Here's a breakdown of what this MetaTrader script does, explained in a way that doesn't require any programming knowledge:
Overall Goal:
This script is designed to create an indicator called the "Accelerator/Decelerator Oscillator" (AC). This indicator is used to gauge the acceleration or deceleration of the current price trend in a financial market. It helps traders visually identify whether the market's momentum is increasing or decreasing.
Core Components and Logic:
-
Least Squares Moving Average (LSMA) Calculation:
- The script relies heavily on a calculation called the "Least Squares Moving Average" (LSMA). Think of a regular moving average as a line that smooths out price fluctuations by averaging prices over a certain period. The LSMA does something similar, but it finds the line that best fits the prices over a given period using a statistical method called "least squares." It's like finding the trendline that minimizes the distance between the line and all the individual price points. It is calculated for two different periods, 5 and 34.
-
Calculating the Oscillator Value:
- The script then calculates the core value of the Accelerator/Decelerator Oscillator. It does this by subtracting a 34-period LSMA from a 5-period LSMA. This difference is the base from which the AC oscillator is created. The result reflects the difference between short-term and longer-term price trends.
-
Smoothing the Oscillator:
- To smooth out the AC values and make them less erratic, the script calculates a Simple Moving Average (SMA) of the AC values over a period of 5. This SMA line acts as a signal line for the oscillator.
-
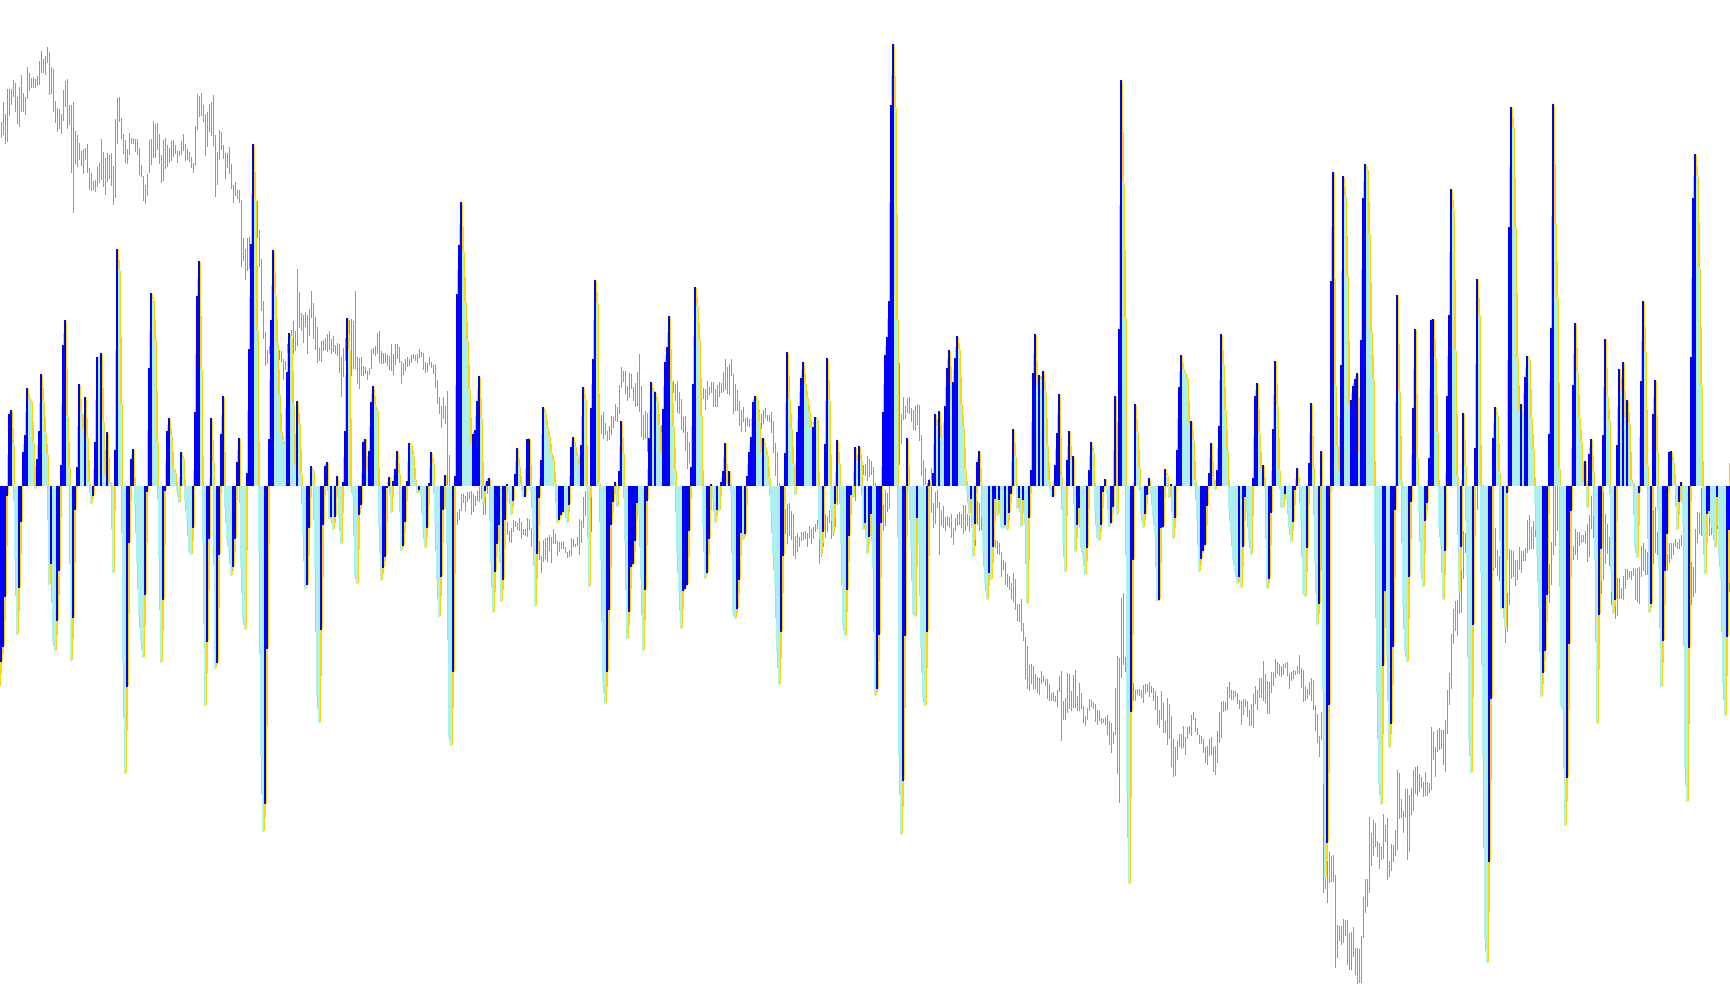
Creating the Histogram (Visual Representation):
- The script doesn't just calculate numbers; it visualizes them. The AC indicator is displayed as a histogram (a bar chart). The histogram bars are colored to represent whether the oscillator value is increasing (momentum is picking up) or decreasing (momentum is slowing down). It compares the current AC value to the previous AC value.
- The script determines if the current AC value is greater than the previous one. If it is, the histogram bar is colored green. If it's not, the histogram bar is colored red.
In Summary:
The script calculates the Accelerator/Decelerator Oscillator by using the LSMA and then subtracting 34 period LSMA from the 5 period one. The result is smoothed with a 5 period SMA. It then visualizes this oscillator as a color-coded histogram. The color of the histogram bars helps traders quickly identify whether the current price trend is gaining or losing momentum, potentially signaling buying or selling opportunities. The yellow line also plots the AC, and there is a zero line to add context to the readings.
//+------------------------------------------------------------------+
//|                                             Accelerator_LSMA.mq4 |
//|                      Copyright © 2005, MetaQuotes Software Corp. |
//|                                       http://www.metaquotes.net/ |
//+------------------------------------------------------------------+
#property  copyright "Copyright © 2005, MetaQuotes Software Corp."
#property  link      "http://www.metaquotes.net/"
//---- indicator settings
#property  indicator_separate_window
#property  indicator_buffers 3
#property  indicator_color1  Yellow
#property  indicator_color2  Green
#property  indicator_color3  Red

#property indicator_level1 0.0
//---- indicator buffers
double     ExtBuffer0[];
double     ExtBuffer1[];
double     ExtBuffer2[];
double     ExtBuffer3[];
double     ExtBuffer4[];
//+------------------------------------------------------------------+
//| Custom indicator initialization function                         |
//+------------------------------------------------------------------+
int init()
  {
//---- 2 additional buffers are used for counting.
   IndicatorBuffers(5);
//---- drawing settings
   SetIndexStyle(0,DRAW_LINE,STYLE_SOLID,2);
   SetIndexStyle(1,DRAW_HISTOGRAM,STYLE_SOLID,2);
   SetIndexStyle(2,DRAW_HISTOGRAM,STYLE_SOLID,2);
   IndicatorDigits(Digits+2);
   SetIndexDrawBegin(0,38);
   SetIndexDrawBegin(1,38);
   SetIndexDrawBegin(2,38);
//---- 4 indicator buffers mapping
   SetIndexBuffer(0,ExtBuffer0);
   SetIndexBuffer(1,ExtBuffer1);
   SetIndexBuffer(2,ExtBuffer2);
   SetIndexBuffer(3,ExtBuffer3);
   SetIndexBuffer(4,ExtBuffer4);
//---- name for DataWindow and indicator subwindow label
   IndicatorShortName("AC");
   SetIndexLabel(1,NULL);
   SetIndexLabel(2,NULL);
//---- initialization done
   return(0);
  }

//+------------------------------------------------------------------------+
//| LSMA - Least Squares Moving Average function calculation               |
//| LSMA_In_Color Indicator plots the end of the linear regression line    |
//+------------------------------------------------------------------------+

double LSMA(int Rperiod, int shift)
{
   int i;
   double sum;
   int length;
   double lengthvar;
   double tmp;
   double wt;

   length = Rperiod;

   sum = 0;
   for(i = length; i >= 1  ; i--)
   {
     lengthvar = length + 1;
     lengthvar /= 3;
     tmp = 0;
     tmp = ( i - lengthvar)*Close[length-i+shift];
     sum+=tmp;
    }
    wt = sum*6/(length*(length+1));

    return(wt);
}


//+------------------------------------------------------------------+
//| Accelerator/Decelerator Oscillator                               |
//+------------------------------------------------------------------+
int start()
  {
   int    limit;
   int    counted_bars=IndicatorCounted();
   double prev,current;
   //---- last counted bar will be recounted
   if(counted_bars>0) counted_bars--;
   limit=Bars-counted_bars;
   //---- macd counted in the 1-st additional buffer
   for(int i=0; i<limit; i++)
      ExtBuffer3[i]=LSMA(5,i)-LSMA(34,i);
   //---- signal line counted in the 2-nd additional buffer
   for(i=0; i<limit; i++)
      ExtBuffer4[i]=iMAOnArray(ExtBuffer3,Bars,5,0,MODE_SMA,i);
   //---- dispatch values between 2 buffers
   bool up=true;
   for(i=limit-1; i>=0; i--)
     {
      current=ExtBuffer3[i]-ExtBuffer4[i];
      prev=ExtBuffer3[i+1]-ExtBuffer4[i+1];
      if(current>prev) up=true;
      if(current<prev) up=false;
      if(!up)
        {
         ExtBuffer2[i]=current;
         ExtBuffer1[i]=0.0;
        }
      else
        {
         ExtBuffer1[i]=current;
         ExtBuffer2[i]=0.0;
        }
       ExtBuffer0[i]=current;
     }
   //---- done
   return(0);
  }
Comments