AbsoluteStrength_v1DH
Download script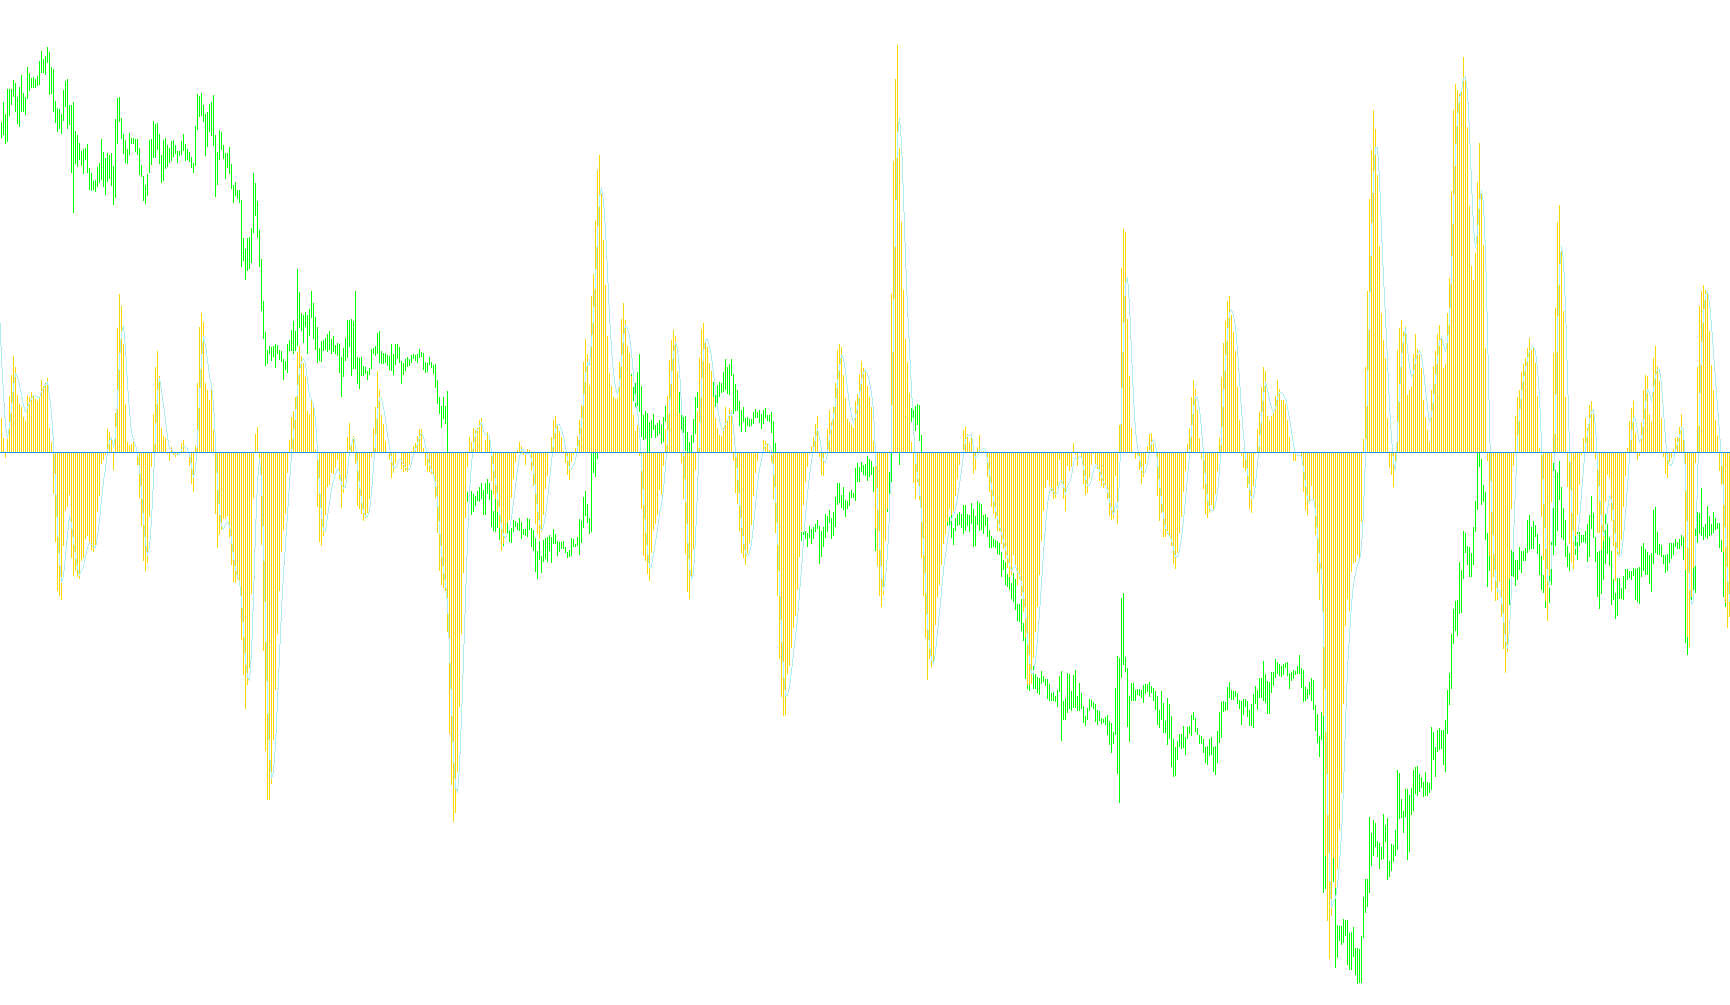
The AbsoluteStrength indicator is a technical analysis tool designed to measure the momentum and dominance of either buyers (Bulls) or sellers (Bears) within a specific timeframe. Unlike standard oscillators that might just show price direction, this script attempts to quantify "strength" by calculating how much pressure is pushing the market in one direction versus the other.
How it Works
The logic operates through a multi-layered processing system that takes raw price data and refines it into smooth, readable visual signals:
1. Core Calculation (Strength Identification) Depending on your chosen settings, the indicator identifies the "raw" strength using one of two primary methods:
- RSI Method: This focuses on the difference between the current price and the previous price. It isolates whether the movement was positive or negative to determine which side is winning the immediate tug-of-war.
- Stochastic Method: This looks at the highest highs and lowest lows over a specific period. It measures where the current price sits relative to those extremes, essentially determining if the price is "stretched" toward the top (bullish) or bottom (bearish).
2. Multi-Stage Smoothing To prevent the indicator from reacting too violently to minor market "noise," the script passes the raw strength data through three consecutive layers of averaging:
- Averaging: It first calculates a primary average of the bulls and bears.
- Smoothing: It then takes that average and applies a second layer of smoothing to create a more stable trend line.
- Signal Generation: Finally, it applies a third "Signal" calculation. This creates a trailing line that helps traders identify when the strength is accelerating or decelerating.
Visual Representation
The indicator provides four distinct visual elements on your chart:
- Bullish/Bearish Histograms: These represent the primary smoothed strength of the buyers and sellers.
- Signal Lines: These act as a secondary reference point. When the main strength lines move significantly away from these signal lines, it often indicates a shift in momentum.
Summary for Traders
In simple terms, this tool helps you see the "invisible" force behind price movement. By filtering out market volatility through multiple layers of averages, it allows you to see whether the trend is being driven by sustained strength or if the current movement is losing steam, helping you make more informed decisions on whether to follow a trend or prepare for a reversal.
//+------------------------------------------------------------------+
//|       AbsoluteStrength_v1DH              AbsoluteStrength_v1.mq4 |
//|                           Copyright © 2006, TrendLaboratory Ltd. |
//|            http://finance.groups.yahoo.com/group/TrendLaboratory |
//|                                       E-mail: igorad2004@list.ru |
//+------------------------------------------------------------------+
#property copyright "Copyright © 2006, TrendLaboratory Ltd."
#property link      "http://finance.groups.yahoo.com/group/TrendLaboratory"

#property indicator_separate_window
#property indicator_buffers   4
#property indicator_color1    LightBlue
#property indicator_width1    2
#property indicator_color2    Tomato
#property indicator_width2    1
#property indicator_color3    Aqua
#property indicator_width3    1
#property indicator_style3    3
#property indicator_color4    Orange
#property indicator_width4    1
#property indicator_style4    3
//---- input parameters
extern int       Mode =  0; // 0-RSI method; 1-Stoch method
extern int       Length = 10; // Period
extern int       Smooth =  5; // Period of smoothing
extern int       Signal =  5; // Period of Signal Line
extern int       Price  =  0; // Price mode : 0-Close,1-Open,2-High,3-Low,4-Median,5-Typical,6-Weighted
extern int       ModeMA =  3; // Mode of Moving Average
//---- buffers
double Bulls[];
double Bears[];
double AvgBulls[];
double AvgBears[];
double SmthBulls[];
double SmthBears[];
double SigBulls[];
double SigBears[];

//+------------------------------------------------------------------+
//| Custom indicator initialization function                         |
//+------------------------------------------------------------------+
int init()
  {
//---- indicators
   IndicatorBuffers(8);
   SetIndexStyle(0,DRAW_HISTOGRAM);
   SetIndexBuffer(0,SmthBulls);
   SetIndexStyle(1,0);
   SetIndexBuffer(1,SmthBears);
   SetIndexStyle(2,DRAW_LINE);
   SetIndexBuffer(2,SigBulls);
   SetIndexStyle(3,DRAW_LINE);
   SetIndexBuffer(3,SigBears);

   SetIndexBuffer(4,Bulls);
   SetIndexBuffer(5,Bears);
   SetIndexBuffer(6,AvgBulls);
   SetIndexBuffer(7,AvgBears);
//---- name for DataWindow and indicator subwindow label
   string short_name="AbsoluteStrength("+Mode+","+Length+","+Smooth+","+Signal+","+ModeMA+")";
   IndicatorShortName(short_name);
   SetIndexLabel(0,"Bulls");
   SetIndexLabel(1,"Bears");
   SetIndexLabel(2,"SignalBulls");
   SetIndexLabel(3,"SignalBears");
//----
   SetIndexDrawBegin(0,Length+Smooth+Signal);
   SetIndexDrawBegin(1,Length+Smooth+Signal);
   SetIndexDrawBegin(2,Length+Smooth+Signal);
   SetIndexDrawBegin(3,Length+Smooth+Signal);

   return(0);
  }

//+------------------------------------------------------------------+
//| Custom indicator iteration function                              |
//+------------------------------------------------------------------+
int start()
  {
   int      shift, limit, counted_bars=IndicatorCounted();
   double   Price1, Price2, smax, smin;
//----
   if ( counted_bars < 0 ) return(-1);
   if ( counted_bars ==0 ) limit=Bars-Length+Smooth+Signal-1;
   if ( counted_bars < 1 )
   for(int i=1;i<Length+Smooth+Signal;i++)
   {
   Bulls[Bars-i]=0;
   Bears[Bars-i]=0;
   AvgBulls[Bars-i]=0;
   AvgBears[Bars-i]=0;
   SmthBulls[Bars-i]=0;
   SmthBears[Bars-i]=0;
   SigBulls[Bars-i]=0;
   SigBears[Bars-i]=0;
   }


   if(counted_bars>0) limit=Bars-counted_bars;
   limit--;

   for( shift=limit; shift>=0; shift--)
      {
      Price1 = iMA(NULL,0,1,0,0,Price,shift);
      Price2 = iMA(NULL,0,1,0,0,Price,shift+1);

         if (Mode==0)
         {
         Bulls[shift] = (0.5*(MathAbs(Price1-Price2)+(Price1-Price2)))-0.5*(MathAbs(Price1-Price2)-(Price1-Price2));
         Bears[shift] = -0.5*(MathAbs(Price1-Price2)-(Price1-Price2))+0.5*(MathAbs(Price1-Price2)-(Price1-Price2));
         }

         if (Mode==1)
         {
         smax=High[Highest(NULL,0,MODE_HIGH,Length,shift)];
         smin=Low[Lowest(NULL,0,MODE_LOW,Length,shift)];

         Bulls[shift] = Price1 - smin;
         Bears[shift] = -(smax - Price1)+(smax-Price1);
         }
      }

      for( shift=limit; shift>=0; shift--)
      {
      AvgBulls[shift]=iMAOnArray(Bulls,0,Length,0,ModeMA,shift);
      AvgBears[shift]=iMAOnArray(Bears,0,Length,0,ModeMA,shift);
      }

      for( shift=limit; shift>=0; shift--)
      {
      SmthBulls[shift]=iMAOnArray(AvgBulls,0,Smooth,0,ModeMA,shift);
      SmthBears[shift]=iMAOnArray(AvgBears,0,Smooth,0,ModeMA,shift);
      }

      for( shift=limit; shift>=0; shift--)
      {
      SigBulls[shift]=iMAOnArray(SmthBulls,0,Signal,0,ModeMA,shift);
      SigBears[shift]=iMAOnArray(SmthBears,0,Signal,0,ModeMA,shift);
      }
//----
   return(0);
  }
//+------------------------------------------------------------------+
Comments