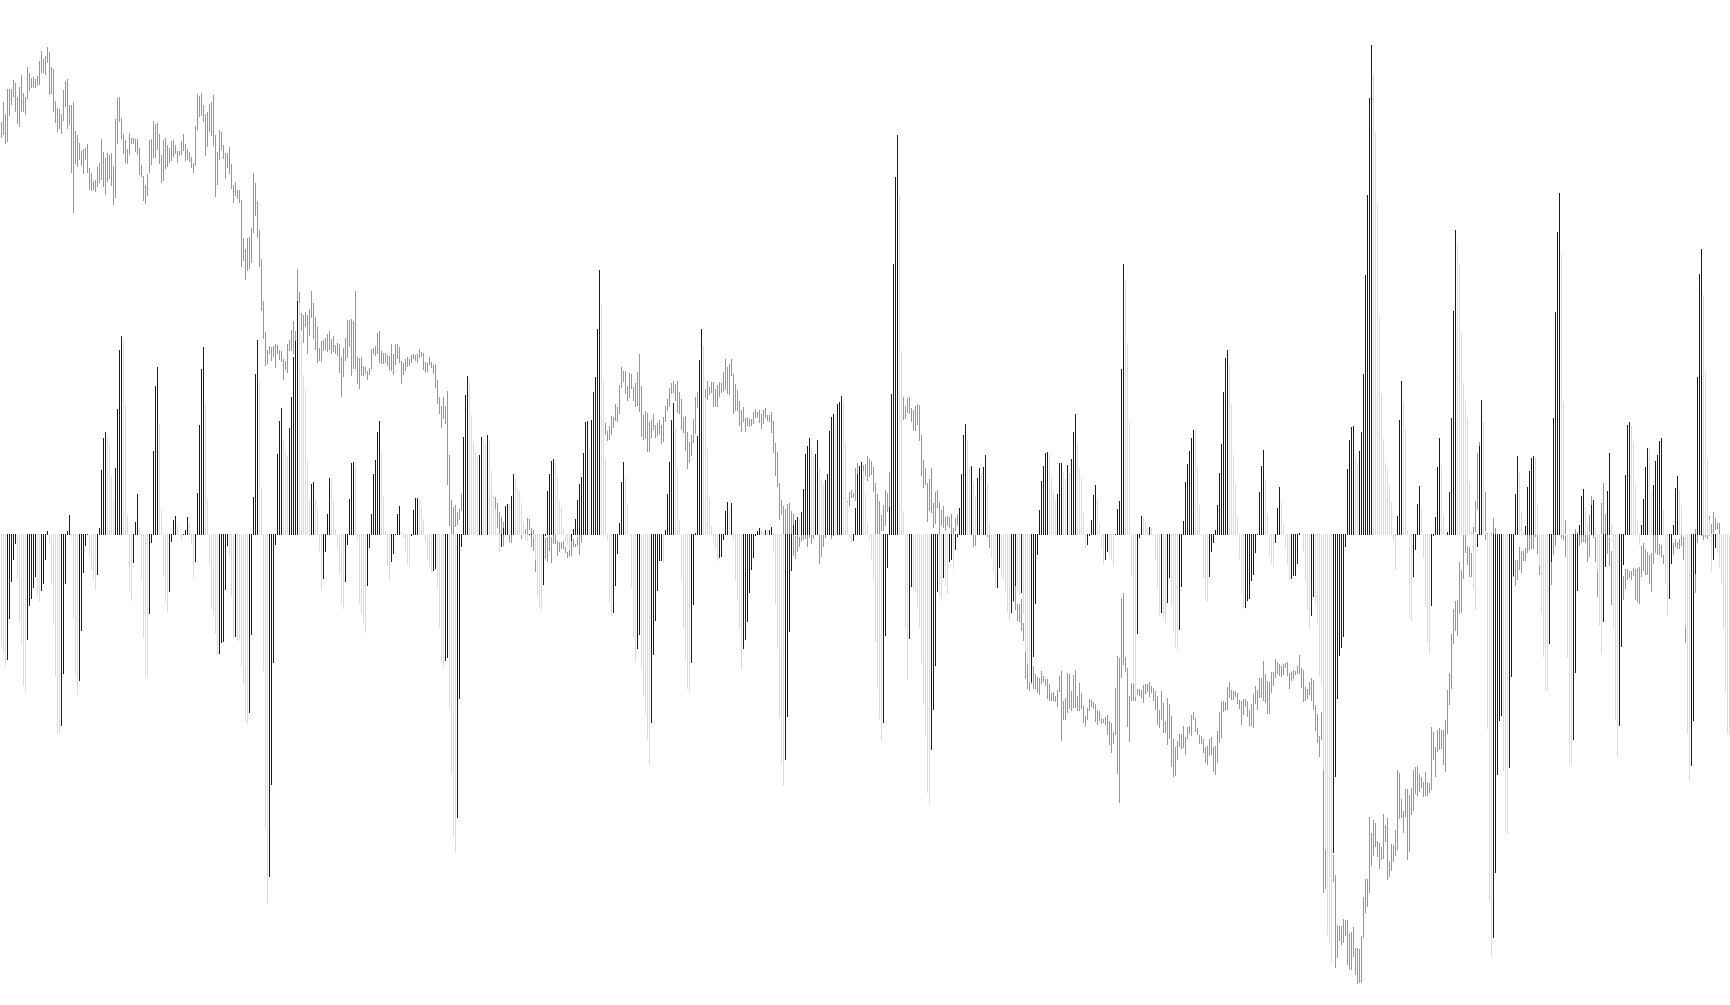
The Accelerator/Decelerator Oscillator is a technical analysis tool designed to help traders understand the underlying momentum of a market's price movement. Rather than just looking at whether a price is going up or down, this indicator measures the "speed" and "acceleration" of that movement, helping to identify when a trend is gaining strength or beginning to lose steam.
How the Logic Works
The tool functions by layering three distinct mathematical processes to generate its visual output:
1. Establishing the Base Momentum (MACD Foundation) The logic first calculates a standard momentum value. It does this by comparing two different moving averages: a "Fast" average (which reacts quickly to recent price changes) and a "Slow" average (which reflects the broader, long-term trend). By subtracting the slow average from the fast average, the script identifies the current distance between short-term and long-term price actions.
2. Smoothing the Signal Once the base momentum is established, the script applies a secondary smoothing layer (the "Signal Line"). This acts as a filter to remove minor market "noise," allowing the tool to focus on the more significant, underlying shifts in price behavior rather than every tiny fluctuation.
3. Calculating the Accelerator and Decelerator The core logic then compares the raw momentum against its smoothed signal line. The difference between these two values reveals the "acceleration":
- Acceleration: When the momentum is increasing faster than the average trend, it suggests the current move has significant "gas" behind it.
- Deceleration: When the momentum begins to fall behind the average trend, it serves as a warning that the move may be exhausting itself.
Visual Representation
The indicator displays these findings in a dedicated sub-window on your trading chart:
- Trend Detection: The script tracks whether the difference between the momentum and its signal is increasing or decreasing.
- Dynamic Visualization: Based on this direction, the tool populates a histogram. It essentially highlights the "active" side of the movement—showing one color (usually Green) when the momentum is expanding in an upward fashion and another color (usually Red) when it is contracting or moving downward.
Summary for Traders
In simple terms, this script doesn't just tell you where the price is; it tells you how hard the market is pushing in that direction. By monitoring these shifts in acceleration and deceleration, it helps traders spot potential trend reversals before they fully materialize, providing a clearer picture of whether a current move has "legs" or if the market is starting to tire out.
//+------------------------------------------------------------------+
//|                                                  Accelerator.mq4 |
//|                      Copyright © 2005, MetaQuotes Software Corp. |
//|                                       http://www.metaquotes.net/ |
//+------------------------------------------------------------------+
#property  copyright "Copyright © 2005, MetaQuotes Software Corp."
#property  link      "http://www.metaquotes.net/"
//---- indicator settings
#property  indicator_separate_window
#property  indicator_buffers 3
#property  indicator_color1  Black
#property  indicator_color2  Green
#property  indicator_color3  Red

extern int FastAO = 5;
extern int SlowAO = 34;
extern int AC=5;

//---- indicator buffers
double     ExtBuffer0[];
double     ExtBuffer1[];
double     ExtBuffer2[];
double     ExtBuffer3[];
double     ExtBuffer4[];
//+------------------------------------------------------------------+
//| Custom indicator initialization function                         |
//+------------------------------------------------------------------+
int init()
  {
//---- 2 additional buffers are used for counting.
   IndicatorBuffers(5);
//---- drawing settings
   SetIndexStyle(0,DRAW_NONE);
   SetIndexStyle(1,DRAW_HISTOGRAM);
   SetIndexStyle(2,DRAW_HISTOGRAM);
   IndicatorDigits(Digits+2);
   SetIndexDrawBegin(0,38);
   SetIndexDrawBegin(1,38);
   SetIndexDrawBegin(2,38);
//---- 4 indicator buffers mapping
   SetIndexBuffer(0,ExtBuffer0);
   SetIndexBuffer(1,ExtBuffer1);
   SetIndexBuffer(2,ExtBuffer2);
   SetIndexBuffer(3,ExtBuffer3);
   SetIndexBuffer(4,ExtBuffer4);
//---- name for DataWindow and indicator subwindow label
   IndicatorShortName("AC");
   SetIndexLabel(1,NULL);
   SetIndexLabel(2,NULL);
//---- initialization done
   return(0);
  }
//+------------------------------------------------------------------+
//| Accelerator/Decelerator Oscillator                               |
//+------------------------------------------------------------------+
int start()
  {
   int    limit;
   int    counted_bars=IndicatorCounted();
   double prev,current;
   //---- last counted bar will be recounted
   if(counted_bars>0) counted_bars--;
   limit=Bars-counted_bars;
   //---- macd counted in the 1-st additional buffer
   for(int i=0; i<limit; i++)
      ExtBuffer3[i]=iMA(NULL,0,FastAO,0,MODE_SMA,PRICE_MEDIAN,i)-iMA(NULL,0,SlowAO,0,MODE_SMA,PRICE_MEDIAN,i);
   //---- signal line counted in the 2-nd additional buffer
   for(i=0; i<limit; i++)
      ExtBuffer4[i]=iMAOnArray(ExtBuffer3,Bars,AC,0,MODE_SMA,i);
   //---- dispatch values between 2 buffers
   bool up=true;
   for(i=limit-1; i>=0; i--)
     {
      current=ExtBuffer3[i]-ExtBuffer4[i];
      prev=ExtBuffer3[i+1]-ExtBuffer4[i+1];
      if(current>prev) up=true;
      if(current<prev) up=false;
      if(!up)
        {
         ExtBuffer2[i]=current;
         ExtBuffer1[i]=0.0;
        }
      else
        {
         ExtBuffer1[i]=current;
         ExtBuffer2[i]=0.0;
        }
       ExtBuffer0[i]=current;
     }
   //---- done
   return(0);
  }
//+------------------------------------------------------------------+
Comments