60m CHART - STEPRSI_V2
Download script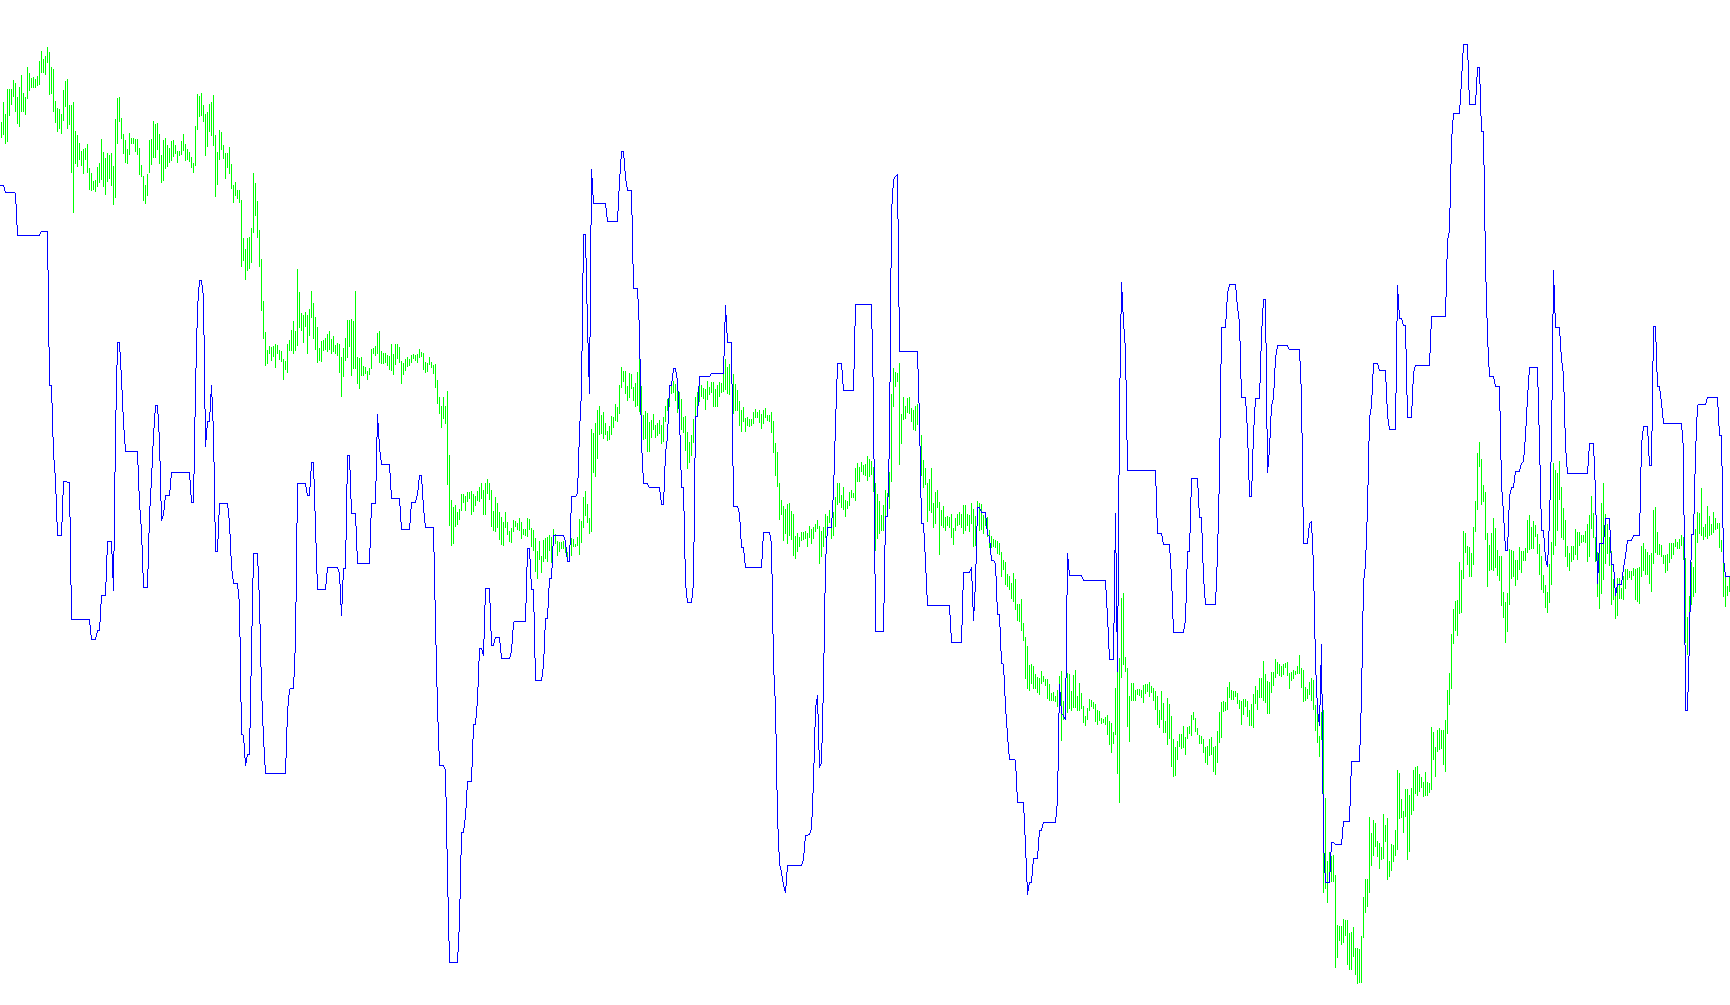
The StepRSI_v2 tool is a specialized technical indicator designed to help traders visualize momentum and identify trend reversals by layering "safety zones" over the standard Relative Strength Index (RSI). Unlike a standard RSI, which can be jagged and fluctuate rapidly, this script introduces a logic of "steps" or boundaries to smooth out market noise and clarify the direction of price movement.
Core Logic Overview
The indicator operates by calculating three distinct visual elements: a baseline RSI, a fast-moving trend boundary, and a slow-moving trend boundary. Its primary purpose is to determine whether the market momentum is breaking out of a specific range or if it is remaining contained within an established "step."
How the Logic Works
The script processes price data through three main stages:
1. Baseline Measurement At its foundation, the tool calculates the standard RSI based on a user-defined period (defaulting to 13). This represents the raw momentum of the current market.
2. The "Fast" and "Slow" Boundary System The script creates two separate layers of logic—one for short-term movements (Fast) and one for long-term trends (Slow). For each of these layers, it calculates a potential "buffer zone" around the RSI value.
- If the RSI moves significantly beyond its current boundary, the script registers a trend change.
- Once a trend is established, the boundary "locks" in a way that requires a significant move in the opposite direction to break it. This prevents the indicator from flickering back and forth during minor price consolidations.
3. Visual Trend Identification The logic translates these calculations into three distinct visual lines:
- The Base RSI: Shows the current momentum level.
- The Fast Step (Blue Line): Represents immediate trend dynamics. It adjusts to quick shifts in price but maintains enough of a "step" to ignore insignificant fluctuations.
- The Slow Step: Provides a broader perspective on the market's direction, showing where the primary, long-term momentum is heading.
Summary for Traders
By using this logic, the indicator helps you distinguish between a temporary "hiccup" in price and a legitimate shift in momentum. When the RSI moves outside of the established boundaries (the steps), it signals a potential change in trend. Conversely, as long as the RSI stays within these stepped boundaries, it suggests that the current momentum is still intact. This provides a cleaner, more structured view of market behavior compared to looking at a standard, fluctuating RSI line alone.
//+------------------------------------------------------------------+
//|                                                   StepRSI_v2.mq4 |
//|                           Copyright © 2005, TrendLaboratory Ltd. |
//|                                       E-mail: igorad2004@list.ru |
//+------------------------------------------------------------------+
#property copyright "Copyright © 2005, TrendLaboratory Ltd."
#property link      "E-mail: igorad2004@list.ru"

#property indicator_separate_window
#property indicator_minimum 0
#property indicator_maximum 100
#property indicator_buffers 3
#property indicator_color1 LightGray
#property indicator_color2 Blue
#property indicator_color3 LightGray

//---- input parameters
extern int PeriodRSI=13;
extern int StepSizeFast=4;
extern int StepSizeSlow=50;
//extern int HighLow=0;
//---- indicator buffers
double Line1Buffer[];
double Line2Buffer[];
double Line3Buffer[];
//+------------------------------------------------------------------+
//| Custom indicator initialization function                         |
//+------------------------------------------------------------------+
  int init()
  {
   string short_name;
//---- indicator line
   SetIndexStyle(0,DRAW_NONE,STYLE_SOLID);
   SetIndexStyle(1,DRAW_LINE,STYLE_SOLID);
   SetIndexStyle(2,DRAW_LINE,STYLE_SOLID);
   SetIndexBuffer(0,Line1Buffer);
   SetIndexBuffer(1,Line2Buffer);
   SetIndexBuffer(2,Line3Buffer);
   IndicatorDigits(MarketInfo(Symbol(),MODE_DIGITS));
//---- name for DataWindow and indicator subwindow label
   short_name="StepRSI("+PeriodRSI+","+StepSizeFast+","+StepSizeSlow+")";
   IndicatorShortName(short_name);
   SetIndexLabel(0,"RSI");
   SetIndexLabel(1,"StepRSI fast");
   SetIndexLabel(2,"StepRSI slow");
//----
   SetIndexDrawBegin(0,1);
   SetIndexDrawBegin(1,1);
   SetIndexDrawBegin(2,1);
//----
   return(0);
  }

//+------------------------------------------------------------------+
//| StepRSI_v2                                                         |
//+------------------------------------------------------------------+
int start()
  {
   int shift,ftrend,strend;
   double fmin0,fmax0,fmin1,fmax1,smin0,smax0,smin1,smax1,RSI0;


   for(shift=Bars-1;shift>=0;shift--)
   {
   RSI0=iRSI(NULL,0,PeriodRSI,PRICE_CLOSE,shift);

	  fmax0=RSI0+2*StepSizeFast;
	  fmin0=RSI0-2*StepSizeFast;

	  if (RSI0>fmax1)  ftrend=1;
	  if (RSI0<fmin1)  ftrend=-1;

	  if(ftrend>0 && fmin0<fmin1) fmin0=fmin1;
	  if(ftrend<0 && fmax0>fmax1) fmax0=fmax1;

	  smax0=RSI0+2*StepSizeSlow;
	  smin0=RSI0-2*StepSizeSlow;

	  if (RSI0>smax1)  strend=1;
	  if (RSI0<smin1)  strend=-1;

	  if(strend>0 && smin0<smin1) smin0=smin1;
	  if(strend<0 && smax0>smax1) smax0=smax1;


	  Line1Buffer[shift]=RSI0;

	  if (ftrend>0) Line2Buffer[shift]=fmin0+StepSizeFast;
	  if (ftrend<0) Line2Buffer[shift]=fmax0-StepSizeFast;

	  if (strend>0) Line3Buffer[shift]=smin0+StepSizeSlow;
	  if (strend<0) Line3Buffer[shift]=smax0-StepSizeSlow;

	  fmin1=fmin0;
	  fmax1=fmax0;
	  smin1=smin0;
	  smax1=smax0;
	 }
	return(0);
 }
Comments