RSI_EMA_MTF
Download script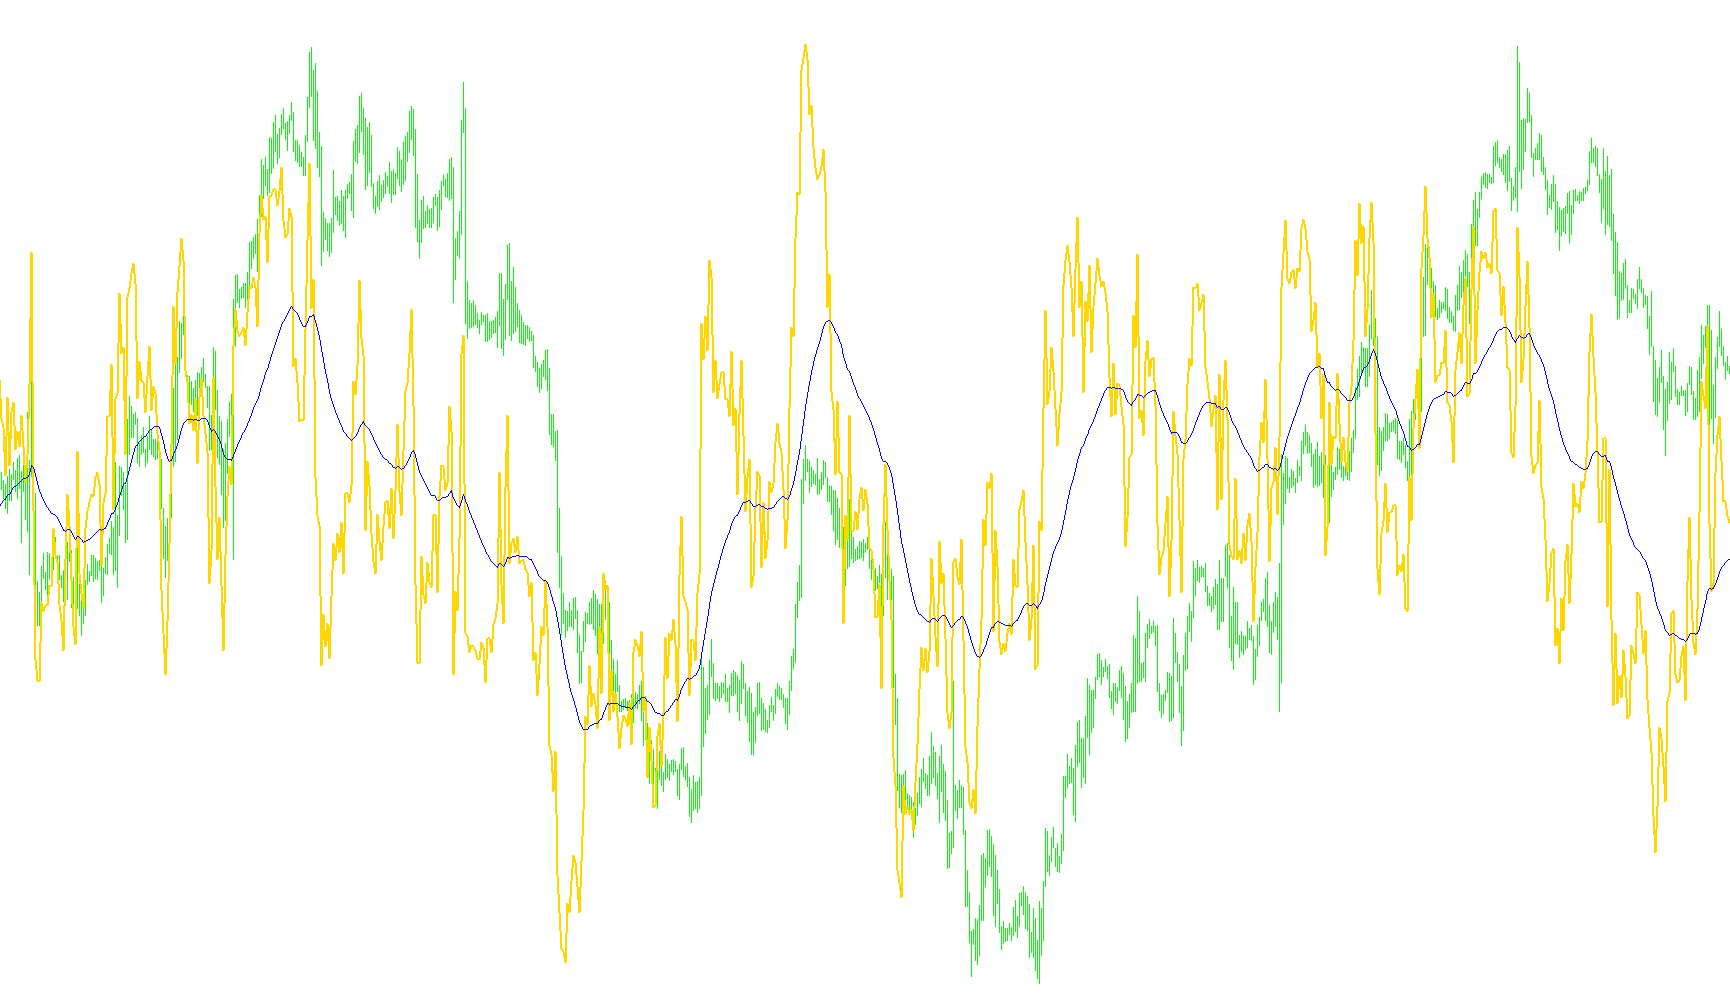
This tool is designed to help traders analyze market momentum by visualizing data from a higher timeframe directly on their current chart. It acts as a bridge, allowing you to see the "big picture" trends without constantly switching between different timeframes.
Core Functionality
The script performs three primary operations to generate its visual data:
1. Multi-Timeframe RSI Calculation The indicator primarily tracks the Relative Strength Index (RSI), which is a common tool used to measure the speed and change of price movements. Instead of just looking at the current chart's timeframe, this script allows you to select a specific higher timeframe (for example, viewing Hourly data while you are trading on a 15-minute chart).
2. Moving Average Smoothing To filter out market "noise" and provide a clearer trend line, the script applies a Moving Average to the RSI values. By smoothing out the rapid fluctuations of the RSI, the indicator helps highlight more stable, long-term momentum shifts rather than temporary spikes.
3. Data Alignment and Synchronization Because different timeframes have different amounts of data, the script includes logic to synchronize the information. It calculates the correct historical position of the higher timeframe data so that it aligns perfectly with the bars on your current screen. This ensures that the lines you see accurately represent the market's status at any given moment.
Visual Output
The tool produces two distinct lines in a separate window:
- The Primary Momentum Line: Represents the raw RSI value from your chosen higher timeframe.
- The Trend Line: Represents the smoothed Moving Average of that RSI, helping you identify whether the momentum is gaining or losing strength over time.
User Customization
The script provides several settings to tailor the analysis:
- RSI Period: Adjusts how much historical data is used to calculate momentum.
- Timeframe: Allows you to choose which higher timeframe's data you want to overlay on your current chart.
- MA Type & Period: Lets you define how the smoothing line behaves, determining whether it reacts quickly to changes or remains steady to show long-term trends.
#property copyright "Kalenzo"
#property link      "bartlomiej.gorski@gmail.com"

#property indicator_separate_window
#property indicator_buffers 2
#property indicator_color1 DodgerBlue
#property indicator_color2 Lime

extern int RsiPeriod = 14;
extern int MaType = 1;
extern int MaPeriod = 50;
extern int TimeFrame = 60;
double g_ibuf_92[];
double g_ibuf_96[];
double g_ibuf_100[];
double g_ibuf_104[];

int init() {
   IndicatorBuffers(4);
   SetIndexBuffer(0, g_ibuf_92);
   SetIndexBuffer(1, g_ibuf_96);
   SetIndexStyle(0, DRAW_LINE, STYLE_SOLID, 2);
   SetIndexStyle(1, DRAW_LINE, STYLE_SOLID, 1);
   SetIndexBuffer(2, g_ibuf_100);
   SetIndexBuffer(3, g_ibuf_104);
   IndicatorShortName("MTF RSI " + tf());
   return (0);
}

int deinit() {
   return (0);
}

int start() {
   int l_shift_0;
   int l_bars_4 = Bars;
   int li_8 = iBars(Symbol(), TimeFrame);
   for (int li_12 = 0; li_12 < li_8; li_12++) g_ibuf_100[li_12] = iRSI(Symbol(), TimeFrame, RsiPeriod, PRICE_CLOSE, li_12);
   for (int li_16 = 0; li_16 < li_8; li_16++) g_ibuf_104[li_16] = iMAOnArray(g_ibuf_100, 0, MaPeriod, 0, MaType, li_16);
   for (int l_index_20 = 0; l_index_20 < l_bars_4; l_index_20++) {
      l_shift_0 = iBarShift(Symbol(), TimeFrame, Time[l_index_20]);
      g_ibuf_92[l_index_20] = g_ibuf_100[l_shift_0];
      g_ibuf_96[l_index_20] = g_ibuf_104[l_shift_0];
   }
   return (0);
}

string tf() {
   switch (TimeFrame) {
   case PERIOD_M1:
      return ("M(1)");
   case PERIOD_M5:
      return ("M(5)");
   case PERIOD_M15:
      return ("M(15)");
   case PERIOD_M30:
      return ("M(30)");
   case PERIOD_H1:
      return ("H(1)");
   case PERIOD_H4:
      return ("H(4)");
   case PERIOD_D1:
      return ("D(1)");
   case PERIOD_W1:
      return ("W(1)");
   case PERIOD_MN1:
      return ("MN(1)");
   }
   return ("Unknown timeframe");
}
Comments