RSI_LiDo
Download script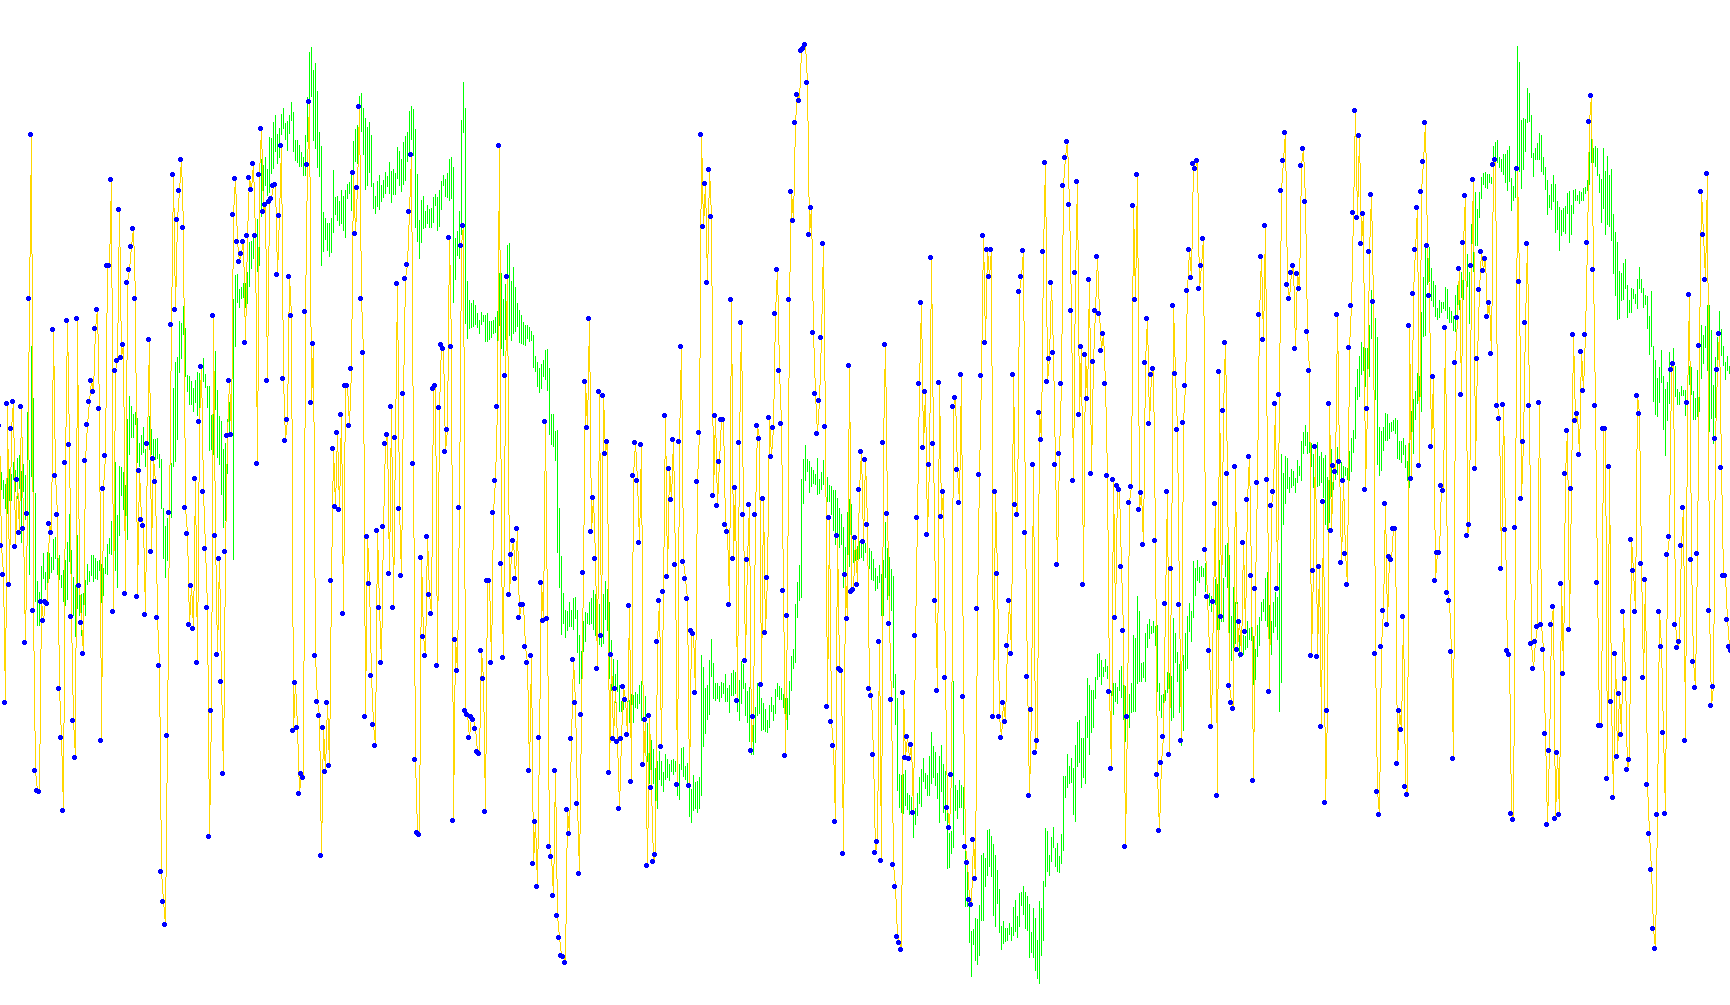
This tool is a specialized technical analysis indicator designed to help traders visualize price momentum and identify potential market turning points. It builds upon the Relative Strength Index (RSI), a standard financial tool used to measure whether an asset is being overbought or oversold.
Core Functionality
The script focuses on tracking the "strength" of price movements over a specific window of time. By analyzing the closing prices of recent candles, it calculates a momentum score that oscillates between 0 and 100.
Key Visual Elements
- The Momentum Line: The primary component of the tool is a continuous line that tracks the RSI value. This allows you to see the flow of the market trends in real-time. If the line moves upward, it suggests increasing buying pressure; moving downward suggests increasing selling pressure.
- Visual Markers (Dots): In addition to the smooth line, the script places specific dots along the path. These serve as visual anchors, highlighting the exact data points calculated for each period, making it easier to pinpoint specific moments of momentum shifts.
- Reference Zones: The indicator utilizes four distinct horizontal levels (75, 65, 35, and 25). These act as "zones" that help traders identify:
- Overextended Markets: When the line climbs into the upper zones, it indicates the asset may be reaching a point where buying has become excessive.
- Depleted Markets: When the line drops into the lower zones, it suggests that selling may have reached an extreme point.
How It Works for the User
The logic is governed by a customizable "Period" setting. A shorter period makes the indicator highly responsive to immediate, rapid price changes, while a longer period smooths out the data to show broader market trends. By combining the continuous line with specific dots and pre-defined levels, this tool provides a clear, organized view of where the market momentum is headed, helping you spot potential opportunities before they fully develop.
//+------------------------------------------------------------------+
//|                                                     RSI_LiDo.mq4 |
//|                      Copyright © 2004, MetaQuotes Software Corp. |
//|                                       http://www.metaquotes.net/ |
//| original "RSI_dot" concept by Accrete, and nicely tweaked by     |
//| telsa of ForexFactory fame !! Many thanks telsa...Accrete        |
//+------------------------------------------------------------------+
#property copyright "Copyright © 2004, MetaQuotes Software Corp."
#property link      "http://www.metaquotes.net/"

#property indicator_separate_window
#property indicator_minimum 0
#property indicator_maximum 100

#property indicator_buffers 2
#property indicator_color1 DodgerBlue
#property indicator_color2 Lime
#property indicator_level1 75
#property indicator_level2 65
#property indicator_level3 35
#property indicator_level4 25


//---- input parameters
extern int RSIPeriod=4;

//---- buffers
double dRsiLine[];
double dRsiDots[];

int init() {

    IndicatorShortName("RSI LiDo (" + RSIPeriod + ")");

    SetIndexBuffer(0,dRsiLine);
    SetIndexStyle (0,DRAW_LINE);
    SetIndexLabel (0,"RSI");

    SetIndexBuffer(1,dRsiDots);
    SetIndexStyle (1,DRAW_ARROW);
    SetIndexArrow (1,159);
    SetIndexLabel (1,"RSI");

    return(0);
}

int start() {

    // Determine how far back to iterate
    int iBarsToCalc = Bars - IndicatorCounted();
    if (iBarsToCalc < Bars) iBarsToCalc++;

    for (int i=iBarsToCalc-1;i>=0;i--) {
        dRsiLine[i] = iRSI(NULL,0,RSIPeriod,PRICE_CLOSE,i);
        dRsiDots[i] = dRsiLine[i];
    }
}
//__________________

 //Will Code For Pips
Comments