RSI_MultiBuySellAvg
Download script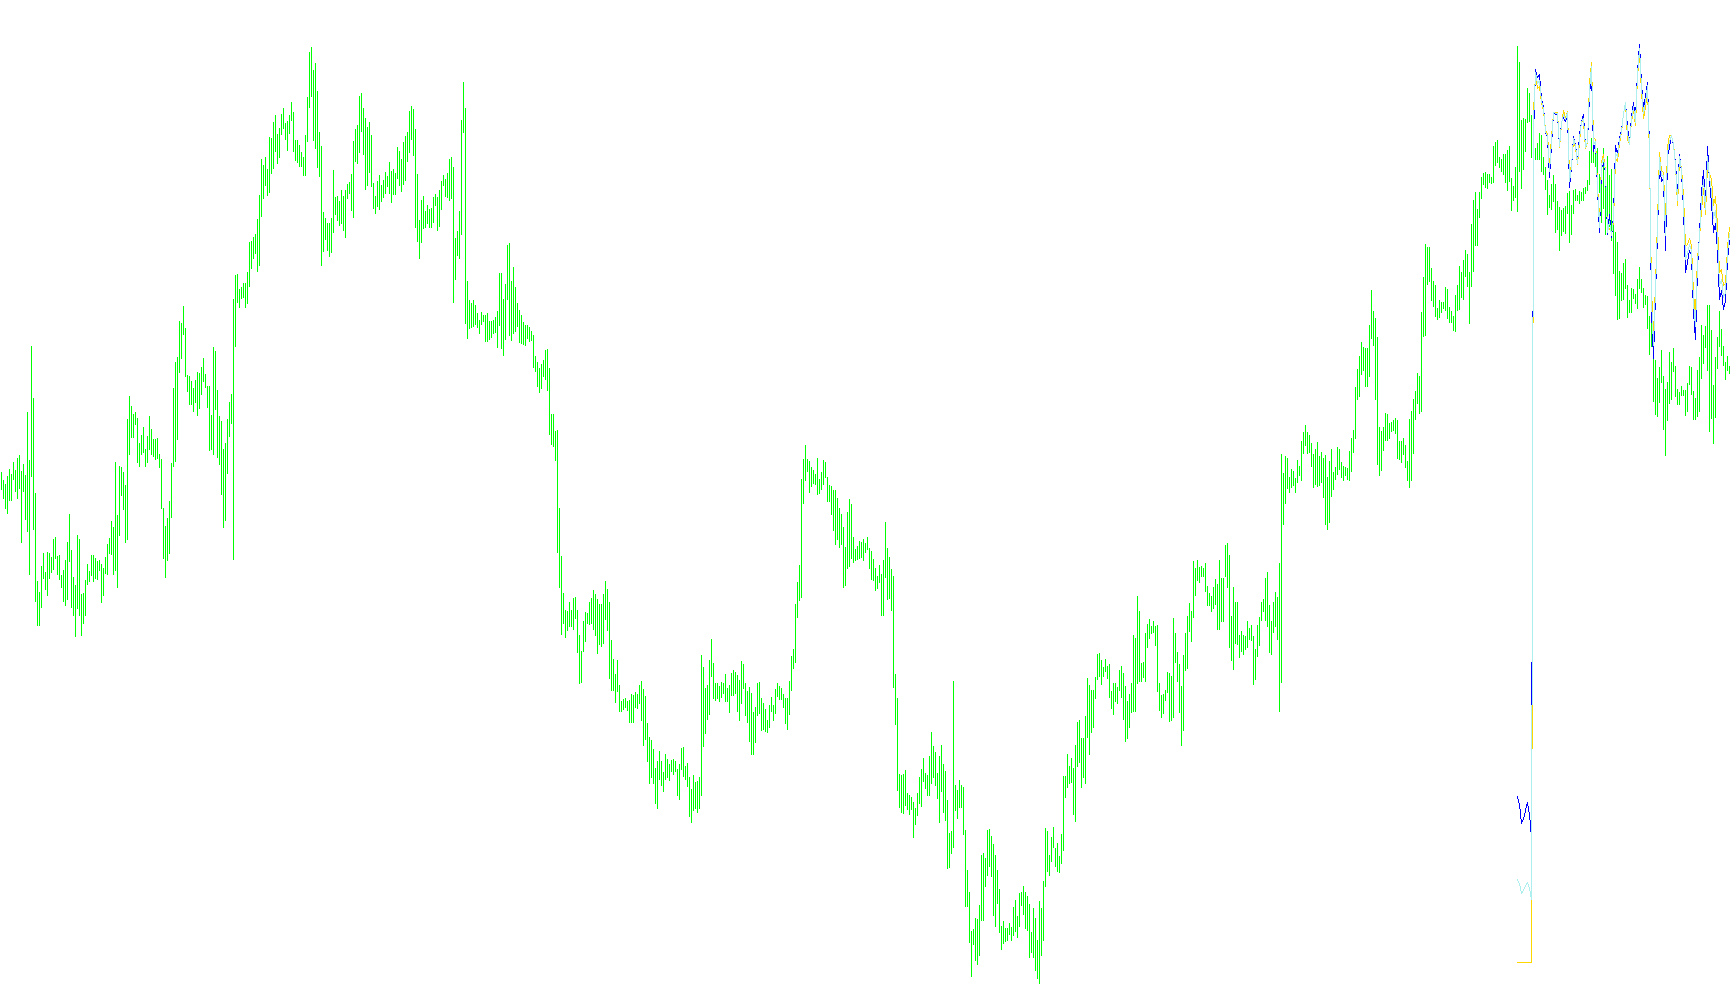
This script is designed as a technical analysis tool for the MetaTrader platform that monitors multiple currency pairs simultaneously to provide a high-level overview of market sentiment. Instead of looking at just one chart, it aggregates data from several different pairs to create a "composite" view of the market.
Core Logic and Functionality
Multi-Pair Analysis The tool is divided into two distinct groups:
- Buy Currency Pairs: A predefined list of assets that the user identifies as having positive momentum or "buy" potential.
- Sell Currency Pairs: A separate list of assets identified as having negative momentum or "sell" potential.
The RSI Calculation The script uses a common technical indicator called the Relative Strength Index (RSI) for every pair in both lists. The RSI measures the speed and change of price movements, helping to determine if an asset is overbought, oversold, or trending in a specific direction.
Data Aggregation (Averaging) Rather than showing you 14 different lines on your screen, the script performs real-time math to simplify the data:
- Buy Average: It calculates the RSI for all pairs in the "Buy" list and computes their mathematical average. This results in a single line representing the collective strength of your bullish targets.
- Sell Average: It does the same for the "Sell" list, creating a single line that represents the collective strength of your bearish targets.
- Total Average: It combines both groups to provide a final "All Average" line, showing the overall balance between the two sentiments.
Automatic Symbol Correction The script includes a built-in safety feature to ensure it communicates correctly with your specific broker. Different brokers often use slightly different naming conventions for currency pairs (for example, adding a suffix like ".m" or "_i"). The script automatically detects these suffixes and adjusts the pair names so the data remains accurate regardless of which broker you use.
Visual Output
The result is a clean, three-line indicator displayed in a separate window at the bottom of your chart:
- Lime Line: Represents the averaged momentum of your "Buy" list.
- Red Line: Represents the averaged momentum of your "Sell" list.
- White Line: Represents the combined average of all monitored pairs.
By looking at where these lines sit in relation to one another, you can visually gauge whether the market is leaning more toward your bullish targets or your bearish targets across a broad spectrum of currencies.
//+---------------------------------------------------------------------+
//|                                    Copyright © 2008, Robert Hill    |
//+---------------------------------------------------------------------+
#property copyright "Copyright © 2008, Robert Hill"
#property link      ""
#property indicator_separate_window
#property indicator_buffers 3
#property indicator_color1 Lime
#property indicator_color2 Red
#property indicator_color3 White

extern string Buy_currency_pairs = "----- List of Buy currency pairs -----";
extern string mPair_1 = "GBPUSD";
extern string mPair_2 = "EURGBP";
extern string mPair_3 = "GBPJPY";
extern string mPair_4 = "USDCHF";
extern string mPair_5 = "NZDUSD";
extern string mPair_6 = "AUDJPY";
extern string mPair_7 = "EURJPY";

extern string Sell_currency_pairs = "----- List of Sell currency pairs -----";
extern string mPair_8 = "EURUSD";
extern string mPair_9 = "USDJPY";
extern string mPair_10 = "AUDUSD";
extern string mPair_11 = "NZDJPY";
extern string mPair_12 = "GBPCHF";
extern string mPair_13 = "CHFJPY";
extern string mPair_14 = "EURCHF";

extern int RSI_Period = 14;
extern int BarsBack = 100;

string Pair1, Pair2, Pair3, Pair4, Pair5, Pair6, Pair7;
string Pair8, Pair9, Pair10, Pair11, Pair12, Pair13, Pair14;
double AvgBuy_Buffer[];
double AvgSell_Buffer[];
double AvgAll_Buffer[];

int init()
{
   GetCorrectPairs();
   SetIndexStyle(0,DRAW_LINE,STYLE_SOLID);
   SetIndexBuffer(0,AvgBuy_Buffer);
   SetIndexLabel(0,"Buy Avg");
   SetIndexStyle(1,DRAW_LINE,STYLE_SOLID);
   SetIndexBuffer(1,AvgSell_Buffer);
   SetIndexLabel(1,"Sell Avg");
   SetIndexStyle(2,DRAW_LINE,STYLE_SOLID);
   SetIndexBuffer(2,AvgAll_Buffer);
   SetIndexLabel(2,"All Avg");

   return(0);
}

int deinit()
{
   return(0);
}

int start()
{
   int i, limit;
   int counted_bars = IndicatorCounted();
   double SumBuy, SumSell;
   int NumBuy, NumSell;
   double rsi;

   if(counted_bars < 0) return(-1);
//---- last counted bar will be recounted
   if(counted_bars > 0) counted_bars--;

   limit=BarsBack;

   for(i=0; i<limit; i++)
   {
     SumBuy = 0;
     NumBuy = 0;
     if (StringLen(Pair1) > 0)
     {
       rsi = iRSI(Pair1, 0, RSI_Period, PRICE_CLOSE, i);
       SumBuy += rsi;
       NumBuy++;
     }
     if (StringLen(Pair2) > 0)
     {
       rsi = iRSI(Pair2, 0, RSI_Period, PRICE_CLOSE, i);
       SumBuy += rsi;
       NumBuy++;
     }
     if (StringLen(Pair3) > 0)
     {
       rsi = iRSI(Pair3, 0, RSI_Period, PRICE_CLOSE, i);
       SumBuy += rsi;
       NumBuy++;
     }
     if (StringLen(Pair4) > 0)
     {
       rsi = iRSI(Pair4, 0, RSI_Period, PRICE_CLOSE, i);
       SumBuy += rsi;
       NumBuy++;
     }
     if (StringLen(Pair5) > 0)
     {
       rsi = iRSI(Pair5, 0, RSI_Period, PRICE_CLOSE, i);
       SumBuy += rsi;
       NumBuy++;
     }
     if (StringLen(Pair6) > 0)
     {
       rsi = iRSI(Pair6, 0, RSI_Period, PRICE_CLOSE, i);
       SumBuy += rsi;
       NumBuy++;
     }
     if (StringLen(Pair7) > 0)
     {
       rsi = iRSI(Pair7, 0, RSI_Period, PRICE_CLOSE, i);
       SumBuy += rsi;
       NumBuy++;
     }
     AvgBuy_Buffer[i] = SumBuy / NumBuy;

     SumSell = 0;
     NumSell = 0;
     if (StringLen(Pair8) > 0)
     {
       rsi = iRSI(Pair8, 0, RSI_Period, PRICE_CLOSE, i);
       SumSell += rsi;
       NumSell++;
     }
     if (StringLen(Pair9) > 0)
     {
       rsi = iRSI(Pair9, 0, RSI_Period, PRICE_CLOSE, i);
       SumSell += rsi;
       NumSell++;
     }
     if (StringLen(Pair10) > 0)
     {
       rsi = iRSI(Pair10, 0, RSI_Period, PRICE_CLOSE, i);
       SumSell += rsi;
       NumSell++;
     }
     if (StringLen(Pair11) > 0)
     {
       rsi = iRSI(Pair11, 0, RSI_Period, PRICE_CLOSE, i);
       SumSell += rsi;
       NumSell++;
     }
     if (StringLen(Pair12) > 0)
     {
       rsi = iRSI(Pair12, 0, RSI_Period, PRICE_CLOSE, i);
       SumSell += rsi;
       NumSell++;
     }
     if (StringLen(Pair13) > 0)
     {
       rsi = iRSI(Pair13, 0, RSI_Period, PRICE_CLOSE, i);
       SumSell += rsi;
       NumSell++;
     }
     if (StringLen(Pair14) > 0)
     {
       rsi = iRSI(Pair14, 0, RSI_Period, PRICE_CLOSE, i);
       SumSell += rsi;
       NumSell++;
     }
     AvgSell_Buffer[i] = SumSell / NumSell;
     AvgAll_Buffer[i] = (SumBuy + SumSell) / (NumBuy + NumSell);
   }
return(0);
}

void GetCorrectPairs()
{
   Pair1 = GetCorrectSymbol(mPair_1);
   Pair2 = GetCorrectSymbol(mPair_2);
   Pair3 = GetCorrectSymbol(mPair_3);
   Pair4 = GetCorrectSymbol(mPair_4);
   Pair5 = GetCorrectSymbol(mPair_5);
   Pair6 = GetCorrectSymbol(mPair_6);
   Pair7 = GetCorrectSymbol(mPair_7);


   Pair8 = GetCorrectSymbol(mPair_8);
   Pair9 = GetCorrectSymbol(mPair_9);
   Pair10 = GetCorrectSymbol(mPair_10);
   Pair11 = GetCorrectSymbol(mPair_11);
   Pair12 = GetCorrectSymbol(mPair_12);
   Pair13 = GetCorrectSymbol(mPair_13);
   Pair14 = GetCorrectSymbol(mPair_14);
}

string GetCorrectSymbol(string pair)
{
   string AddChar, myPair;

   myPair = pair;
   if (StringLen(pair) > 0)
   {
     if (StringLen(Symbol()) == 7)
     {
      AddChar = StringSubstr(Symbol(), 6, 1);
      myPair = pair + AddChar;
     }
   }
   return(myPair);

}
Comments