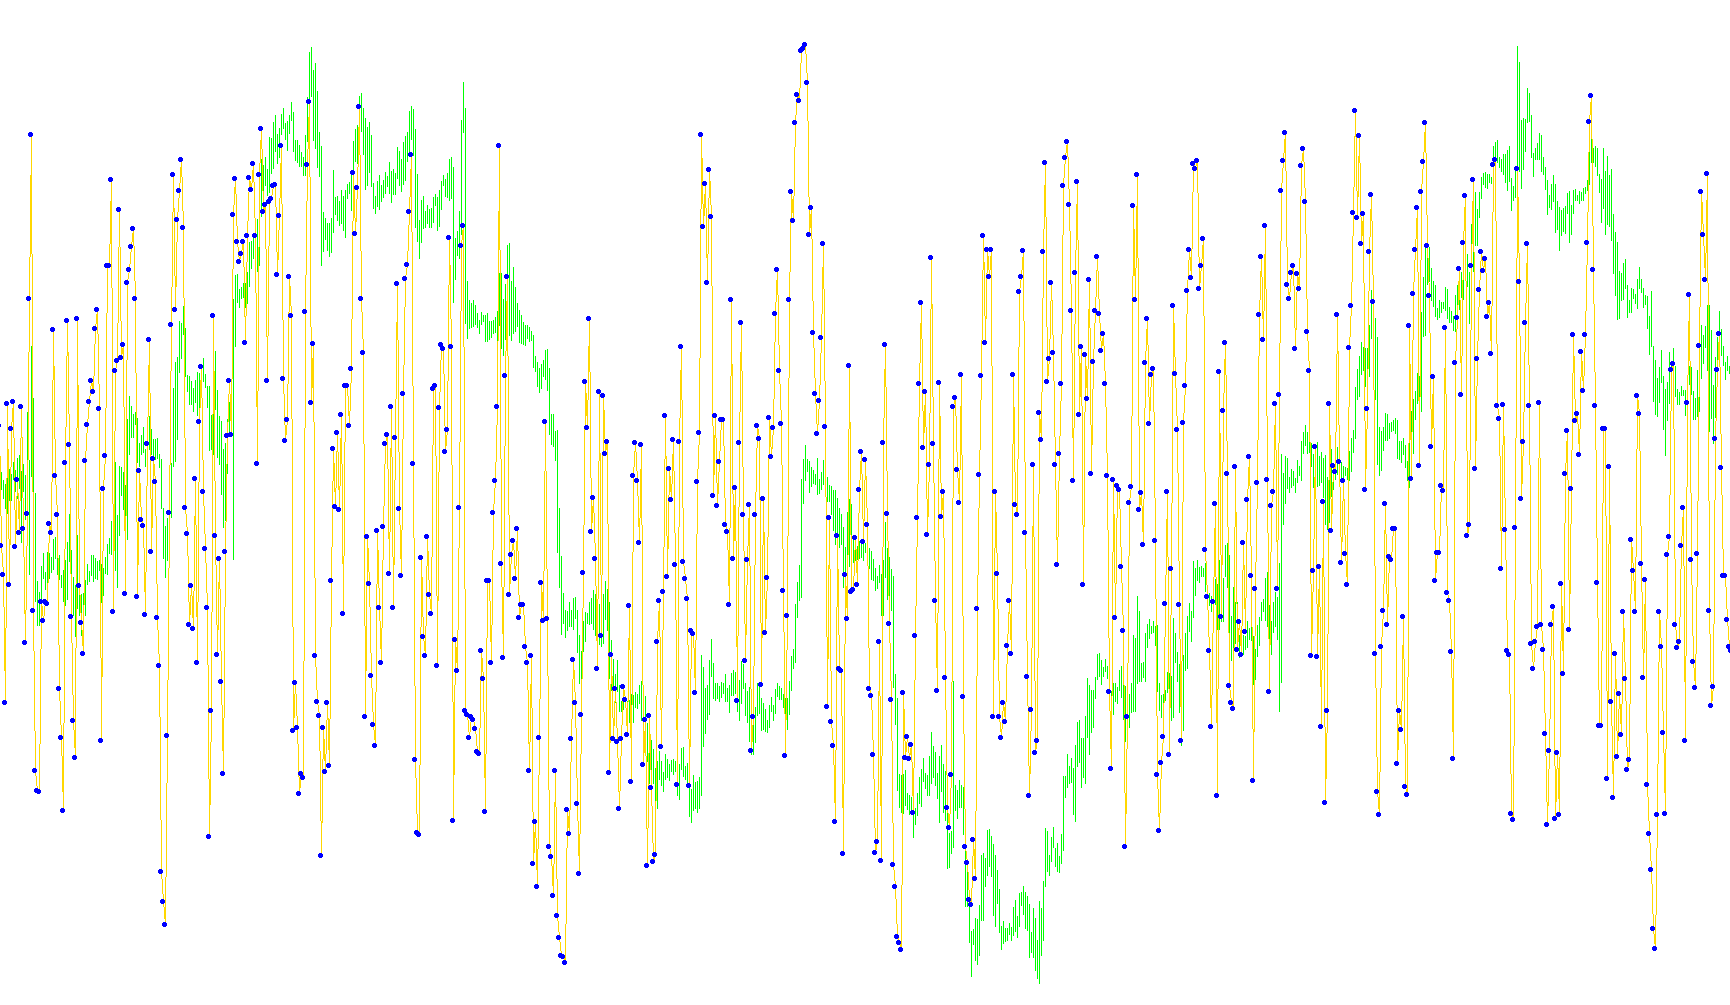
This custom indicator is designed to provide a visual representation of the Relative Strength Index (RSI), a popular momentum oscillator used by traders to determine whether an asset is being overbought or oversold.
Core Functionality
The script tracks the speed and change of price movements over a specific timeframe—defined by the user as the "RSIPeriod." By calculating these dynamics, it creates a visual guide in a separate window below your main price chart, ranging from 0 to 100.
Visual Components
The tool provides two distinct visual elements to help you interpret market momentum:
- The Continuous Line: This represents the actual RSI value. It flows smoothly across the screen, showing the current "strength" of the price trend.
- The Signal Dots: These are markers that track alongside the RSI line. They serve as specific points of reference to highlight the exact values where the indicator is currently positioned.
Key Features & Thresholds
To help you identify potential trading opportunities, the script incorporates several pre-defined horizontal "levels" (75, 65, 35, and 25):
- Overbought Zones: When the line moves toward the upper levels (65 and 75), it signals that the price may have risen too quickly and could be due for a correction or pullback.
- Oversold Zones: When the line moves toward the lower levels (35 and 25), it suggests that the price may have dropped significantly and could be primed for a potential bounce or upward movement.
Summary for Traders
Essentially, this tool simplifies the interpretation of market momentum. Instead of just looking at raw price action, you can use this script to see if the market is "exhausted" in one direction, allowing for more informed decisions on when to enter or exit a trade based on relative strength.
//+------------------------------------------------------------------+
//|                                                     RSI_LiDo.mq4 |
//|                      Copyright © 2004, MetaQuotes Software Corp. |
//|                                       http://www.metaquotes.net/ |
//| original "RSI_dot" concept by Accrete, and nicely tweaked by     |
//| telsa of ForexFactory fame !! Many thanks telsa...Accrete        |
//+------------------------------------------------------------------+
#property copyright "Copyright © 2004, MetaQuotes Software Corp."
#property link      "http://www.metaquotes.net/"

#property indicator_separate_window
#property indicator_minimum 0
#property indicator_maximum 100

#property indicator_buffers 2
#property indicator_color1 DodgerBlue
#property indicator_color2 Lime
#property indicator_level1 75
#property indicator_level2 65
#property indicator_level3 35
#property indicator_level4 25


//---- input parameters
extern int RSIPeriod=4;

//---- buffers
double dRsiLine[];
double dRsiDots[];

int init() {

    IndicatorShortName("RSI LiDo (" + RSIPeriod + ")");

    SetIndexBuffer(0,dRsiLine);
    SetIndexStyle (0,DRAW_LINE);
    SetIndexLabel (0,"RSI");

    SetIndexBuffer(1,dRsiDots);
    SetIndexStyle (1,DRAW_ARROW);
    SetIndexArrow (1,159);
    SetIndexLabel (1,"RSI");

    return(0);
}

int start() {

    // Determine how far back to iterate
    int iBarsToCalc = Bars - IndicatorCounted();
    if (iBarsToCalc < Bars) iBarsToCalc++;

    for (int i=iBarsToCalc-1;i>=0;i--) {
        dRsiLine[i] = iRSI(NULL,0,RSIPeriod,PRICE_CLOSE,i);
        dRsiDots[i] = dRsiLine[i];
    }
}
//__________________

 //Will Code For Pips
Comments