PriceTrender2KbarShift_cw
Download script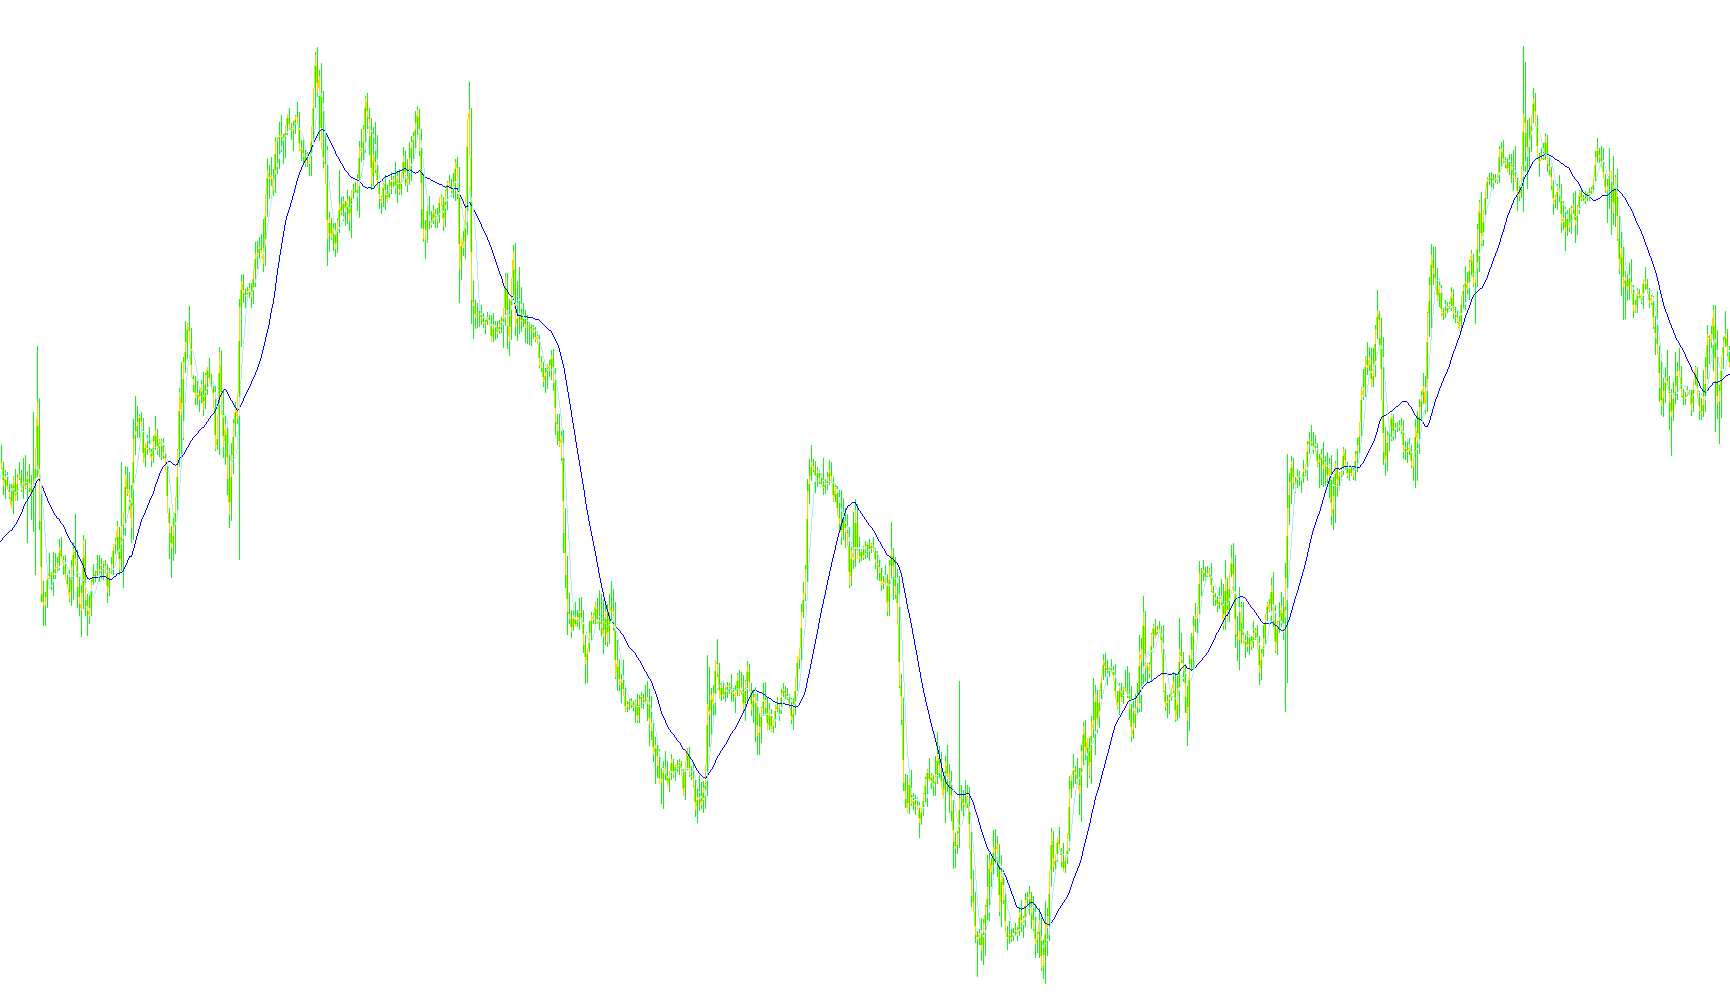
This tool is designed to help traders visualize price movements and trends by analyzing data from a specific timeframe. Instead of just looking at the current chart, it gathers information from a higher timeframe to provide a broader perspective on where the market might be heading.
How It Works
The logic follows a three-step process to interpret market data:
1. Data Selection The tool allows you to choose exactly which part of the price action you want to track. You can select based on various standard price points, such as:
- Opening or Closing prices
- The highest or lowest points reached during a period
- Calculated averages (such as the midpoint between the high and low, or more complex averages involving all four price points)
2. Multi-Timeframe Analysis A key feature of this script is its ability to "look ahead" at different time scales. By synchronizing your current chart with a larger timeframe (e.g., looking at 60-minute data while on a smaller chart), it helps filter out small, distracting price fluctuations and focuses on the more significant directional moves.
3. Trend Mapping The script calculates two distinct moving averages based on the data selected above. By using different lengths for these averages (for example, one that looks at a longer history versus one that looks at a very recent window), it identifies:
- The primary momentum of the market.
- Short-term fluctuations or "noise."
Visual Output
The results are displayed on your chart as three distinct lines. These lines represent the smoothed price data and the two different trend calculations. By observing how these lines interact—such as when they converge, cross one another, or move in opposite directions—traders can better identify the prevailing market trend and potential shifts in momentum.
//+------------------------------------------------------------------+
//|                                                PriceTrender2.mq4 |
//|                                                          Kalenzo |
//|                                      bartlomiej.gorski@gmail.com |
//+------------------------------------------------------------------+
#property copyright "Kalenzo"
#property link      "bartlomiej.gorski@gmail.com"
#property indicator_buffers 3
#property indicator_color1 DodgerBlue
#property indicator_color2 Gold
#property indicator_color3 Lime

extern int TimeFrame = 60,
           Price = 0,
           Ma1Type = 0,
           Ma1Price = 0,
           Ma1Length = 24,
           Ma2Type = 0,
           Ma2Price = 0,
           Ma2Length = 5;


double price[],trend[],trend2[];

#property indicator_chart_window
//+------------------------------------------------------------------+
//| Custom indicator initialization function                         |
//+------------------------------------------------------------------+
int init()
  {
//---- indicators
SetIndexBuffer(0,price);
SetIndexBuffer(1,trend);
SetIndexBuffer(2,trend2);

SetIndexStyle(0,DRAW_LINE,STYLE_SOLID,1);
SetIndexStyle(1,DRAW_LINE,STYLE_SOLID,1);
SetIndexStyle(2,DRAW_LINE,STYLE_SOLID,1);

//----
   return(0);
  }
//+------------------------------------------------------------------+
//| Custom indicator deinitialization function                       |
//+------------------------------------------------------------------+
int deinit()
  {
//----

//----
   return(0);
  }
//+------------------------------------------------------------------+
//| Custom indicator iteration function                              |
//+------------------------------------------------------------------+
int start()
  {
   int    limit, bigshift;
   int    counted_bars=IndicatorCounted();
//----
   if (counted_bars<0) return(-1);
   if (counted_bars>0) counted_bars--;
   limit=Bars-counted_bars;
   limit=MathMax(limit,TimeFrame/Period());

   for (int i=limit; i>=0; i--)
   {
      bigshift = iBarShift(Symbol(),TimeFrame,Time[i]);

       price[i] = getPrice(bigshift);
       trend[i] = iMA(Symbol(),TimeFrame,Ma1Length,0,Ma1Type,Ma1Price,bigshift);
       trend2[i] = iMA(Symbol(),TimeFrame,Ma2Length,0,Ma2Type,Ma2Price,bigshift);
   }

//----

   return(0);
  }
//+------------------------------------------------------------------+
double getPrice(int shift)
{
   switch(Price)
   {
      case 0 : return ( iClose(Symbol(),TimeFrame,shift) );
      case 1 : return (iOpen(Symbol(),TimeFrame,shift));
      case 2 : return (iHigh(Symbol(),TimeFrame,shift));
      case 3 : return (iLow(Symbol(),TimeFrame,shift));
      case 4 : return ((iLow(Symbol(),TimeFrame,shift)+iHigh(Symbol(),TimeFrame,shift))/2);
      case 5 : return ((iClose(Symbol(),TimeFrame,shift)+iLow(Symbol(),TimeFrame,shift)+iHigh(Symbol(),TimeFrame,shift))/3);
      case 6 : return ((iOpen(Symbol(),TimeFrame,shift)+iClose(Symbol(),TimeFrame,shift)+iLow(Symbol(),TimeFrame,shift)+iHigh(Symbol(),TimeFrame,shift))/4);
   }
}
Comments