PriceLine_Ron_v01
Download script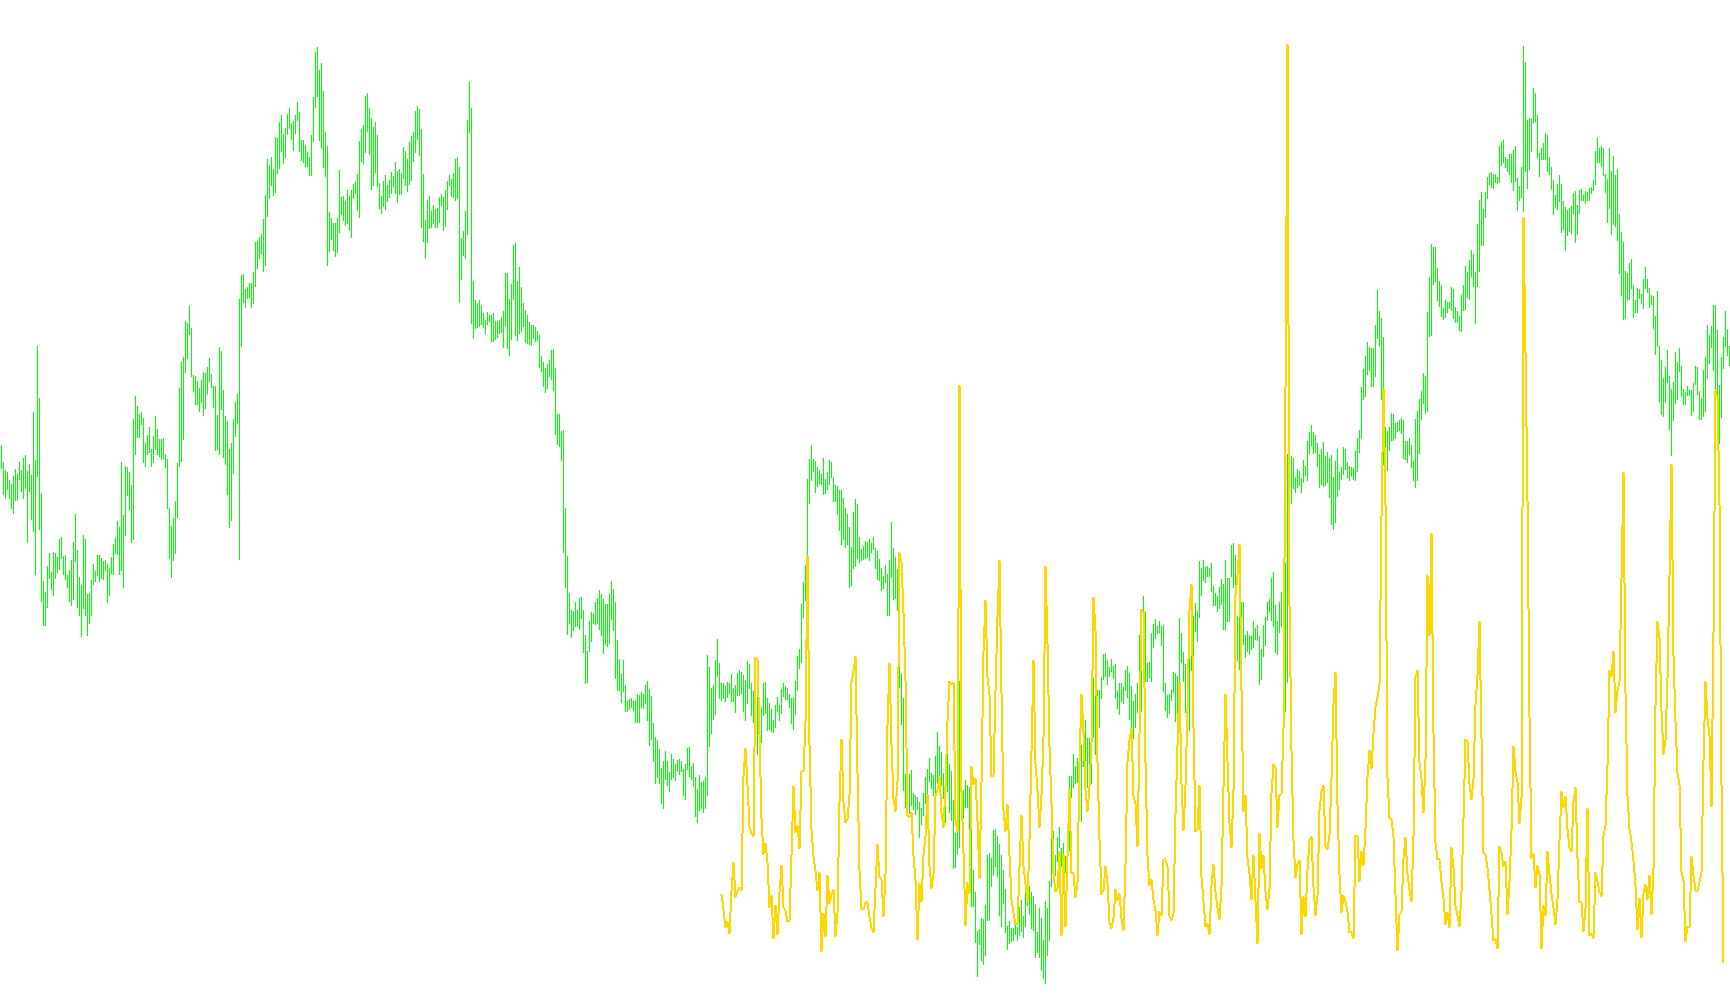
This tool is designed as a custom visual indicator for the MetaTrader platform, specifically engineered to provide a unique perspective on market activity by combining price movement with trading volume.
Core Functionality
The primary objective of this script is to calculate and display a specific metric: Price multiplied by Volume. While standard charts show you where the price is, this indicator illustrates the "weight" or intensity behind those prices. By multiplying the closing price of a candle by its total volume, the tool helps visualize the magnitude of market activity at any given point in time.
How the Logic Works
The script operates using three distinct phases to ensure smooth visual updates on your chart:
- Initialization: When you first load the indicator, the script clears out any existing graphical clutter and prepares a dedicated "buffer" (a memory space) to draw a solid white line. This ensures that the data remains clean and organized from the moment it appears.
- Dynamic Updates: The script is programmed to be "intelligent" about how it updates your screen. It distinguishes between the current live candle and completed historical candles:
- On the Live Candle: To prevent the line from jumping erratically while a candle is still forming, the script only calculates the value for the very last tick of the current bar.
- On Historical Candles: As soon as a new candle begins, the script performs a "sweep." It looks back across a specific number of previous bars (determined by your settings) and populates them with the calculated price-volume data.
- Memory Management: To keep the platform running efficiently, the script includes a cleanup routine. When you remove the indicator from your chart, it automatically wipes the data from its memory and clears the visual buffer to ensure no "ghost" lines or leftover data remain on your workspace.
Summary for the User
In simple terms, this tool provides a historical trajectory of market momentum. Instead of just seeing price action, you are looking at a visualization of "market effort." The resulting line allows you to see where significant volume was moved at specific prices, helping you identify areas of high intensity or relative exhaustion in the market trend.
//+-----------+
//| PriceLine      |
//+-----------+
#property  copyright "Copyright 2005 Ron Thompson"
#property  link      "http://www.forexmt4.com/"

//---- indicator settings
#property  indicator_separate_window

#property indicator_buffers   1
#property indicator_color1  White
//#property indicator_color2  Green
//#property indicator_color3  Red
//#property indicator_color4  Green
//#property indicator_color5  Red
//#property indicator_color6  LawnGreen
//#property indicator_color7  Red
//#property indicator_color8  Yellow


//---- buffers
double ExtMapBuffer1[];  //Yellow
//double ExtMapBuffer2[];  //Green
//double ExtMapBuffer3[];  //Red
//double XBuffer[];        //White
//double ZBuffer[];        //White
//double ExtMapBuffer6[];  //Green
//double ExtMapBuffer7[];  //Red
//double ExtMapBuffer8[];  //Yellow

extern int extDraw4HowLong = 500;


// bar open handling
int    bartime;

//Objects
int    uniq=0;


//+-----------+
//| Init      |
//+-----------+
int init()
  {
   ObjectsDeleteAll();

   SetIndexBuffer(0,ExtMapBuffer1);   //Yellow
   SetIndexStyle(0, DRAW_LINE, STYLE_SOLID, 2);

/*   SetIndexBuffer(1,ExtMapBuffer2);  //Green
   SetIndexStyle(1, DRAW_LINE, STYLE_SOLID, 2);

   SetIndexBuffer(2,ExtMapBuffer3);  //Red
   SetIndexStyle(2, DRAW_LINE, STYLE_SOLID, 2);


   // 233 up arrow
   // 234 down arrow
   // 158 little dot
   // 159 big dot
   // 168 open square
   // 120 box with X
   SetIndexStyle(3,DRAW_ARROW);
   SetIndexBuffer(3, XBuffer);     //Green
   SetIndexArrow(3,233);

   SetIndexStyle(4,DRAW_ARROW);
   SetIndexBuffer(4, ZBuffer);     //Red
   SetIndexArrow(4,234);

   SetIndexBuffer(5,ExtMapBuffer6);  //Green
   SetIndexStyle(5, DRAW_ARROW);
   SetIndexArrow(5,233);

   SetIndexBuffer(6,ExtMapBuffer7);  //Red
   SetIndexStyle(6, DRAW_ARROW);
   SetIndexArrow(6,234);

   SetIndexBuffer(7,ExtMapBuffer8);  //Yellow
   SetIndexStyle(7, DRAW_ARROW);
   SetIndexArrow(7,120);
*/

   Print("Init complete");
  }

//+-----------+
//| DE-Init   |
//+-----------+
int deinit()
  {
   int i;

   for( i=0; i<Bars; i++ )
     {
      ExtMapBuffer1[i]=0;
      //ExtMapBuffer2[i]=0;
      //ExtMapBuffer3[i]=0;
      //XBuffer[i]=0;
      //ZBuffer[i]=0;
      //ExtMapBuffer6[i]=0;
      //ExtMapBuffer7[i]=0;
      //ExtMapBuffer8[i]=0;
     }
   ObjectsDeleteAll();
   Print("DE-Init complete");
  }


//+-----------+
//| Each Tick |
//+-----------+
int start()
  {
   int    pos;

   // draw only bar[0] if not at open of bar
   if(bartime==Time[0])
     {
      ExtMapBuffer1[0] = Close[0]*Volume[0];
     }
   else
     {
      bartime=Time[0];

      for(pos = extDraw4HowLong; pos >= 0; pos--)
        {
         ExtMapBuffer1[pos] = Close[pos]*Volume[pos];
        }//for

     }//if

  }//start
Comments