PriceChannel_Stop_v1_001
Download script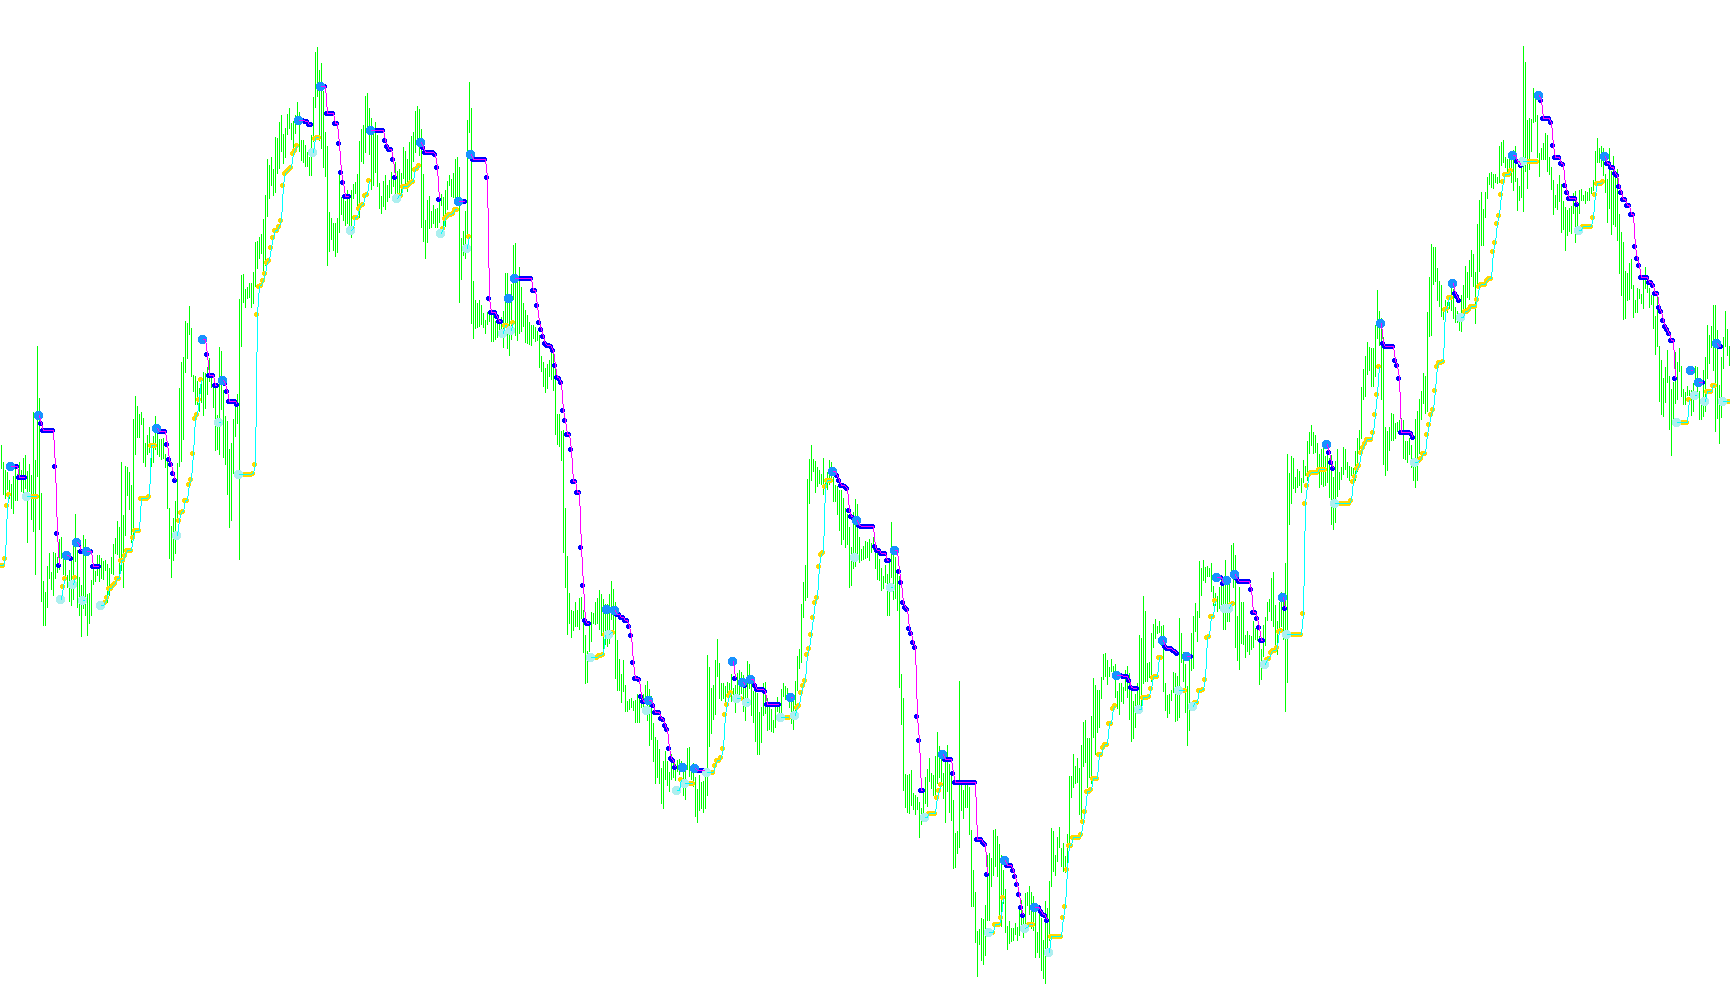
The PriceChannel Stop indicator is designed to help traders visually identify market trends and potential price "breakout" zones. It functions by analyzing historical price volatility to create dynamic boundaries, making it easier to distinguish between sustained movements and temporary market noise.
Core Logic and Functionality
The script operates based on a "Channel" logic. Here is a breakdown of how it processes market data:
1. Range Analysis The indicator looks back over a specific number of candles (the ChannelPeriod) to determine the highest peak and the lowest valley reached during that timeframe. This defines the "trading range."
2. Risk-Based Boundary Creation Instead of just looking at the absolute high and low, the script uses a Risk percentage. It calculates a specific "buffer zone" inside that range.
- In an upward move, it establishes a floor (the bottom support).
- In a downward move, it establishes a ceiling (the top resistance).
3. Trend Detection and Locking The script constantly monitors the closing price relative to these boundaries:
- Bullish Trend: If the price closes above the upper boundary of the previous range, the indicator identifies an upward trend. To ensure stability, it "locks" the support level; it will only move higher as the market progresses, preventing the support line from dropping during a rally.
- Bearish Trend: If the price closes below the lower boundary of the previous range, the indicator identifies a downward trend. In this scenario, it "locks" the resistance level to ensure it only moves lower as the market declines.
4. Visual Signaling The tool provides three distinct visual layers on your chart:
- Trend Lines: These provide a continuous visual of the current support or resistance level based on the active trend.
- Stop Levels: These identify the specific price points where a trend might be considered "broken" or invalidated.
- Signal Markers: Depending on your settings, the script can place specific markers on the chart to alert you when a new trend has officially been confirmed or when a transition between trends has occurred.
Summary for the User
Essentially, this tool filters out minor price fluctuations to show you the "true" direction of the market. By identifying where the price is breaking out of its established range and anchoring those breakout points, it helps traders stay on the right side of a trend while providing clear levels to monitor for potential reversals.
//+------------------------------------------------------------------+
//|                                         PriceChannel_Stop_v1.mq4 |
//|                           Copyright © 2005, TrendLaboratory Ltd. |
//|                                       E-mail: igorad2004@list.ru |
//+------------------------------------------------------------------+
#property copyright "Copyright © 2005, TrendLaboratory Ltd."
#property link      "E-mail: igorad2004@list.ru"

#property indicator_chart_window
#property indicator_buffers 6
#property indicator_color1 Aqua
#property indicator_color2 Magenta
#property indicator_color3 Aqua
#property indicator_color4 Magenta
#property indicator_color5 Aqua
#property indicator_color6 Magenta
//---- input parameters
extern int ChannelPeriod=9;
extern double Risk=0.30;
extern int Signal=1;
extern int Line=1;
extern int Nbars=1000;
//---- indicator buffers
double UpTrendBuffer[];
double DownTrendBuffer[];
double UpTrendSignal[];
double DownTrendSignal[];
double UpTrendLine[];
double DownTrendLine[];
//+------------------------------------------------------------------+
//| Custom indicator initialization function                         |
//+------------------------------------------------------------------+
int init()
  {
   string short_name;
//---- indicator line
   SetIndexBuffer(0,UpTrendBuffer);
   SetIndexBuffer(1,DownTrendBuffer);
   SetIndexBuffer(2,UpTrendSignal);
   SetIndexBuffer(3,DownTrendSignal);
   SetIndexBuffer(4,UpTrendLine);
   SetIndexBuffer(5,DownTrendLine);
   SetIndexStyle(0,DRAW_ARROW);
   SetIndexStyle(1,DRAW_ARROW);
   SetIndexStyle(2,DRAW_ARROW);
   SetIndexStyle(3,DRAW_ARROW);
   SetIndexStyle(4,DRAW_LINE);
   SetIndexStyle(5,DRAW_LINE);
   SetIndexArrow(0,159);
   SetIndexArrow(1,159);
   SetIndexArrow(2,108);
   SetIndexArrow(3,108);
//---- name for DataWindow and indicator subwindow label
   short_name="PriceChannel_Stop_v1("+ChannelPeriod+")";
   IndicatorShortName(short_name);
   SetIndexLabel(0,"UpTrend Stop");
   SetIndexLabel(1,"DownTrend Stop");
   SetIndexLabel(2,"UpTrend Signal");
   SetIndexLabel(3,"DownTrend Signal");
   SetIndexLabel(4,"UpTrend Line");
   SetIndexLabel(5,"DownTrend Line");
//----
   SetIndexDrawBegin(0,ChannelPeriod);
   SetIndexDrawBegin(1,ChannelPeriod);
   SetIndexDrawBegin(2,ChannelPeriod);
   SetIndexDrawBegin(3,ChannelPeriod);
   SetIndexDrawBegin(4,ChannelPeriod);
   SetIndexDrawBegin(5,ChannelPeriod);
//----
   return(0);
  }
//+------------------------------------------------------------------+
//| PriceChannel_Stop_v1                                             |
//+------------------------------------------------------------------+
int start()
  {
   int    i,shift,trend;
   double high, low, price;
   double smax[5000],smin[5000],bsmax[5000],bsmin[5000];

   for (shift=Nbars-1;shift>=0;shift--)
   {
   UpTrendBuffer[shift]=EMPTY_VALUE;
   DownTrendBuffer[shift]=EMPTY_VALUE;
   UpTrendSignal[shift]=EMPTY_VALUE;
   DownTrendSignal[shift]=EMPTY_VALUE;
   UpTrendLine[shift]=EMPTY_VALUE;
   DownTrendLine[shift]=EMPTY_VALUE;
   }
   for (shift=Nbars-ChannelPeriod-1;shift>=0;shift--)
   {
      high=High[shift]; low=Low[shift]; i=shift-1+ChannelPeriod;
      while(i>=shift)
        {
         price=High[i];
         if(high<price) high=price;
         price=Low[i];
         if(low>price)  low=price;
         i--;
        }
     smax[shift]=high;
     smin[shift]=low;

     bsmax[shift]=smax[shift]-(smax[shift]-smin[shift])*Risk;
	  bsmin[shift]=smin[shift]+(smax[shift]-smin[shift])*Risk;

     if (Close[shift]>bsmax[shift+1])  trend=1;
	  if (Close[shift]<bsmin[shift+1])  trend=-1;

	  if(trend>0 && bsmin[shift]<bsmin[shift+1]) bsmin[shift]=bsmin[shift+1];
	  if(trend<0 && bsmax[shift]>bsmax[shift+1]) bsmax[shift]=bsmax[shift+1];

	  if (trend>0)
	  {
	     if (Signal>0 && UpTrendBuffer[shift+1]==-1.0)
	     {
	     UpTrendSignal[shift]=bsmin[shift];
	     if(Line>0) UpTrendLine[shift]=bsmin[shift];
	     }
	     else
	     {
	     UpTrendBuffer[shift]=bsmin[shift];
	     if(Line>0) UpTrendLine[shift]=bsmin[shift];
	     UpTrendSignal[shift]=-1;
	     }
	  if (Signal==2) UpTrendBuffer[shift]=0;
	  DownTrendBuffer[shift]=-1.0;
	  DownTrendLine[shift]=EMPTY_VALUE;
	  }
	  if (trend<0)
	  {
	  if (Signal>0 && DownTrendBuffer[shift+1]==-1.0)
	     {
	     DownTrendSignal[shift]=bsmax[shift];
	     if(Line>0) DownTrendLine[shift]=bsmax[shift];
	     }
	     else
	     {
	     DownTrendBuffer[shift]=bsmax[shift];
	     if(Line>0)DownTrendLine[shift]=bsmax[shift];
	     DownTrendSignal[shift]=-1;
	     }
	  if (Signal==2) DownTrendBuffer[shift]=0;
	  UpTrendBuffer[shift]=-1.0;
	  UpTrendLine[shift]=EMPTY_VALUE;
	  }


   }
   return(0);
  }
//+------------------------------------------------------------------+
Comments