nd2StopLine
Download script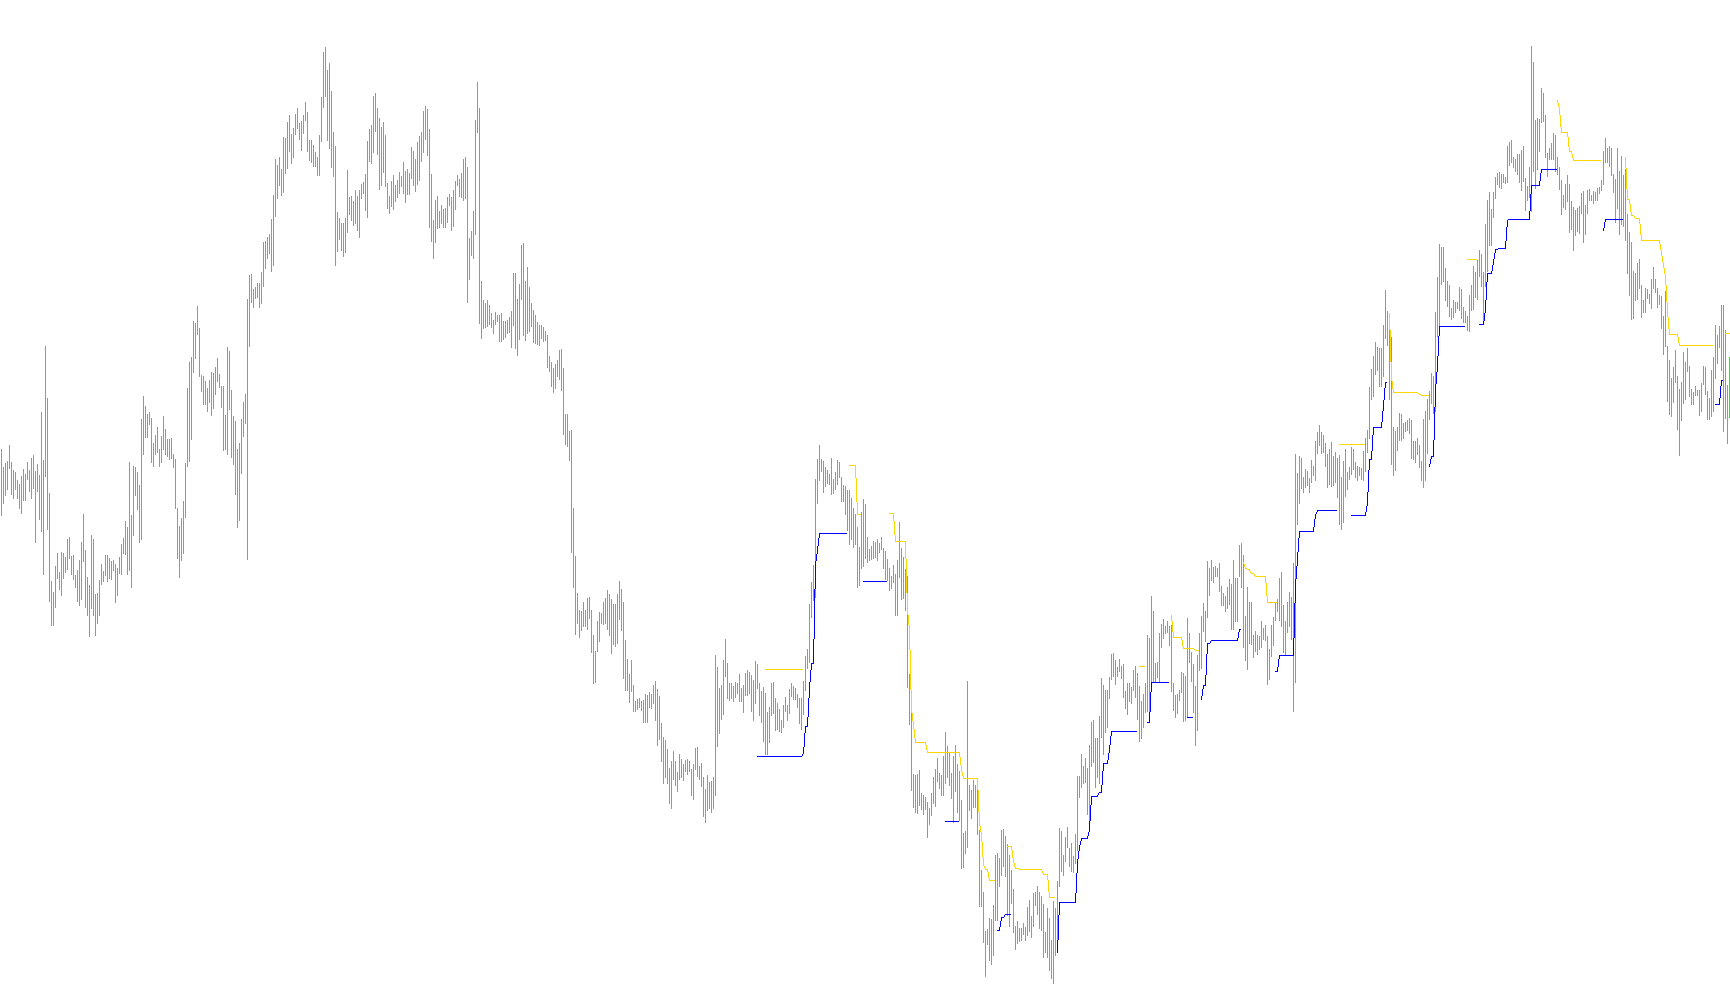
The BrainTrend1StopLine is a technical analysis tool designed to identify and visualize market trends by plotting dynamic "stop lines" on your price chart. Its primary purpose is to help traders distinguish between ongoing momentum and potential trend reversals by calculating a trailing boundary based on historical price volatility.
How the Logic Works
The indicator operates by analyzing two main components: Volatility Measurement and Trend Tracking.
1. Calculating Market Volatility
Before determining the trend, the script measures how much the market is "moving." It looks back at a specific number of recent candles (defined by the AveragePeriod) to calculate an average price range.
- It gives more weight to recent price movements than older ones, ensuring that the current market atmosphere is prioritized.
- This result is converted into a volatility value (WATR), which determines how far away from the current price the "stop line" should be placed.
2. Establishing the Trend Direction
The script evaluates the relationship between the opening and closing prices of the candles to decide the initial direction:
- Upward Trend: If the price closes higher than it opened, the tool initiates an upward trajectory.
- Downward Trend: If the price closes lower than it opened, the tool initiates a downward trajectory.
3. Dynamic Line Movement (The "Trailing" Effect)
Unlike a static moving average, this indicator follows the price dynamically:
- In an Uptrend: The logic searches for new high prices. As long as the price continues to climb and stays above the calculated volatility boundary, the line follows upward. However, if the price drops below this boundary, the script recognizes a "break," flips the trend, and begins plotting a downward line.
- In a Downtrend: The logic searches for new low prices. It tracks the downward movement as long as the price remains below the volatility boundary. If the price rises above that boundary, the trend is considered broken, and the indicator switches to an upward trajectory.
Visual Representation
The indicator displays two distinct lines on your chart:
- Blue Line: Represents the active path of an upward trend.
- Red Line: Represents the active path of a downward trend.
By providing these visual boundaries, the script helps users identify when a trend is still healthy and when the price action has shifted enough to suggest a potential reversal.
//+-----------------------------------------------------------------------+
//|                                               BrainTrend1StopLine.mq4 |
//|                                   Copyright © 2005. Alejandro Galindo |
//|                                                   http://elCactus.com |
//+-----------------------------------------------------------------------+

#property indicator_chart_window
#property indicator_buffers 2
#property indicator_color1 Red
#property indicator_color2 Blue

//---- input parameters
extern int AveragePeriod=10;
extern int Reg=1;

//---- buffers
double Buffer1[];
double Buffer2[];

//+------------------------------------------------------------------+
//| Custom indicator initialization function                         |
//+------------------------------------------------------------------+
int init()
  {
//---- indicator line
   IndicatorBuffers(2);
   SetIndexStyle(0,DRAW_LINE);
   SetIndexStyle(1,DRAW_LINE);
   SetIndexBuffer(0,Buffer1);
   SetIndexBuffer(1,Buffer2);

//----
   return(0);
  }
//+------------------------------------------------------------------+
//| BrainTrend1Stop                                                  |
//+------------------------------------------------------------------+
int start()
  {

   int i,shift,counted_bars=IndicatorCounted();
   double value=0, price=0, trend=0, dK=0, AvgRange=0, WATR=0;
   int bar=0;
   int CountBars=500;
   if (CountBars>=Bars) CountBars=Bars;
   SetIndexDrawBegin(0,Bars-CountBars+11+1);
   SetIndexDrawBegin(1,Bars-CountBars+11+1);

//---- initial zero
   AvgRange=0;
   for (i=1;i<=AveragePeriod;i++)
   {
      dK = 1+(AveragePeriod-i)/AveragePeriod;
      AvgRange=AvgRange+ dK*MathAbs(High[i]-Low[i]);
   }
   if (Point>=0.01) { WATR = (AvgRange/AveragePeriod)*Point; }
   else { WATR = AvgRange/AveragePeriod; }


   if (Close[Bars-1] > Open[Bars-1])
   {
      value = Close[Bars - 1] * (1 - WATR);
      trend = 1;
      Buffer2[Bars-1]=value;
   }
   if (Close[Bars-1] < Open[Bars-1])
   {
      value = Close[Bars - 1] * (1 + WATR);
      trend = -1;
      Buffer1[Bars-1]=value;
   }

   bar=CountBars-11-2;
   while(bar>=0)
   {

//   Buffer1[shift]=0;
//   Buffer2[shift]=0;


   if (Reg==2)
   {
      AvgRange=0;
      for (i=1;i<=AveragePeriod;i++)
      {
         dK = 1+(AveragePeriod-i)/AveragePeriod;
         AvgRange=AvgRange+ dK*MathAbs(High[bar + i]-Low[bar + i]);
      }
      if (Point>=0.01) { WATR = (AvgRange/AveragePeriod)*Point; }
      else { WATR = AvgRange/AveragePeriod; }

   }

   if (trend >= 0)
   {
      if (Close[bar] > price) { price = Close[bar]; }
      value = price * (1 - WATR);
      if (Close[bar] < value)
      {
          price = Close[bar];
          value = price * (1 + WATR);
          trend = -1;
       }
    } else {
      if (trend <= 0) {
         if (Close[bar] < price) { price = Close[bar]; }
         value = price * (1 + WATR);
         if (Close[bar] > value)
         {
             price = Close[bar];
            value = price * (1 - WATR);
            trend = 1;
         }
      }
    }

   if (trend == -1) { Buffer1[bar]=value; }
   if (trend == 1) { Buffer2[bar]=value; }
//----

   bar--;
   }
   return(0);
  }
//+------------------------------------------------------------------+
Comments