nd1StopLine
Download script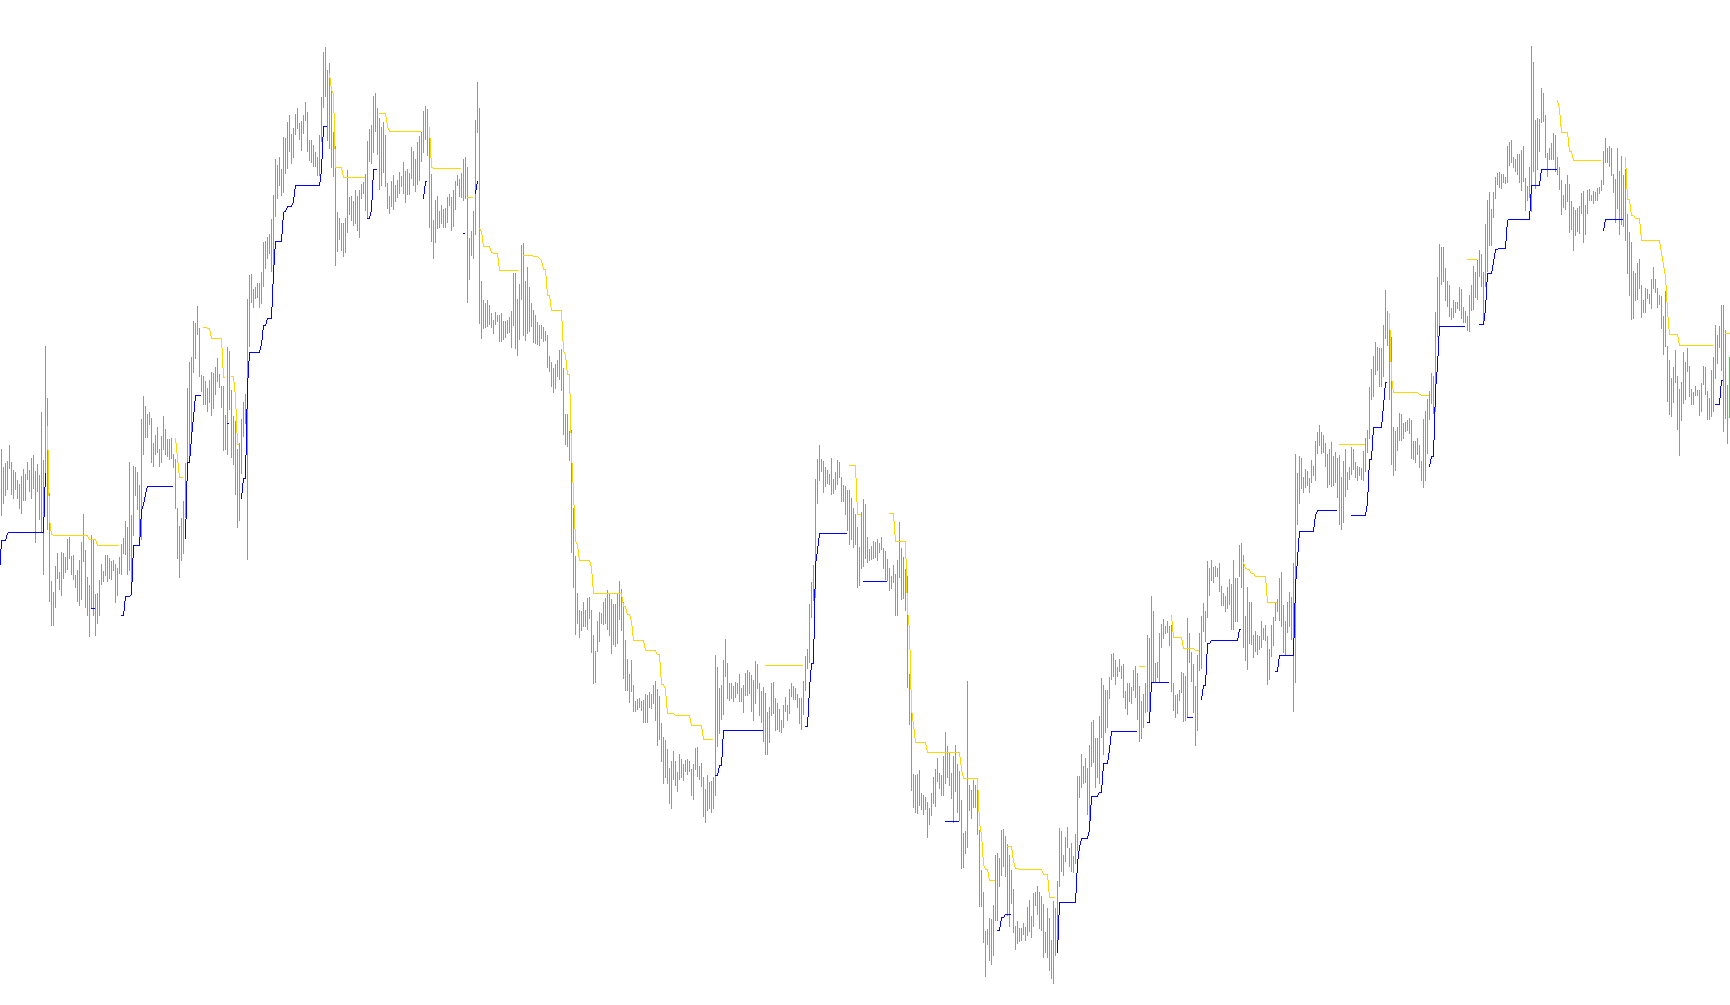
This script is designed to function as a visual trend-following tool for your trading charts. Its primary objective is to identify the current direction of market momentum and automatically plot "stop lines" that help traders visualize potential reversal points.
Core Logic Overview
The indicator works by analyzing price action to determine whether the market is in an uptrend or a downtrend. It uses a dynamic calculation based on the average volatility of recent price bars to set its sensitivity levels. Instead of using a static number, it looks at how much the price typically moves (the range between the high and low) over a specific period to ensure the lines adapt to different market conditions.
How the Trend is Determined
The script follows a logical flow to decide which direction the market is moving:
- Upward Momentum: If the market is trending up, the script tracks the highest price reached during that move. It then projects a line slightly below that peak. If the current price falls below this projected line, the script identifies a potential loss of momentum and switches its focus to a downward trend.
- Downward Momentum: Conversely, if the market is trending down, the script tracks the lowest price reached. It projects a line slightly above that low. If the price climbs above this threshold, the script signals a shift to an upward trend.
Visual Representation
The indicator renders two distinct lines on your chart:
- The Bullish Line (Blue): This appears during upward trends. It acts as a trailing support level; as long as the price stays above this line, the uptrend is considered intact.
- The Bearish Line (Red): This appears during downward trends. It serves as a trailing resistance level; as long as the price stays below this line, the downtrend is considered active.
Summary for Traders
Essentially, this tool acts as a "smart" trailing stop. By calculating the average market volatility, it ensures that the lines aren't too tight (which would cause frequent false signals in choppy markets) nor too wide (which would delay reactions to a trend change). It provides a clear visual cue: when the lines switch colors and directions, it indicates that the script has detected a shift in market sentiment.
//+-----------------------------------------------------------------------+
//|                                               BrainTrend1StopLine.mq4 |
//|                                   Copyright © 2005. Alejandro Galindo |
//|                                                   http://elCactus.com |
//|                        Author := VG many thanks to Konkop and dupidu1 |
//+-----------------------------------------------------------------------+

#property indicator_chart_window
#property indicator_buffers 2
#property indicator_color1 Red
#property indicator_color2 Blue

//---- input parameters
extern int AveragePeriod=10;

//---- buffers
double Buffer1[];
double Buffer2[];

//+------------------------------------------------------------------+
//| Custom indicator initialization function                         |
//+------------------------------------------------------------------+
int init()
  {
//---- indicator line
   IndicatorBuffers(2);
   SetIndexStyle(0,DRAW_LINE);
   SetIndexStyle(1,DRAW_LINE);
   SetIndexBuffer(0,Buffer1);
   SetIndexBuffer(1,Buffer2);

//----
   return(0);
  }
//+------------------------------------------------------------------+
//| BrainTrend1Stop                                                  |
//+------------------------------------------------------------------+
int start()
  {

   int i,shift,counted_bars=IndicatorCounted();
   double value=0, price=0, trend=0, dK=0, AvgRange=0;
   int bar=0;
   int CountBars=20000;
   if (CountBars>=Bars) CountBars=Bars;
   SetIndexDrawBegin(0,Bars-CountBars+11+1);
   SetIndexDrawBegin(1,Bars-CountBars+11+1);

//---- initial zero
   AvgRange=0;
   for (i=1;i<=AveragePeriod;i++) { AvgRange+= MathAbs(High[i]-Low[i]); }
   // fixed to Work with JPY Symbols
   if (Point>=0.01) { dK = (AvgRange/AveragePeriod)*Point; }
   else { dK = (AvgRange/AveragePeriod); }
   if (Close[Bars-1] > Open[Bars-1])
   {
      value = Close[Bars - 1] * (1 - dK);
      trend = 1;
      Buffer2[Bars-1]=value;
   }
   if (Close[Bars-1] < Open[Bars-1])
   {
      value = Close[Bars - 1] * (1 + dK);
      trend = -1;
      Buffer1[Bars-1]=value;
   }

   bar=CountBars-11-1;
   while(bar>=0)
   {

   Buffer1[shift]=0;
   Buffer2[shift]=0;

   if (trend >= 0)
   {
      if (Close[bar] > price) { price = Close[bar]; }
      value = price * (1 - dK);
      if (Close[bar] < value)
      {
          price = Close[bar];
          value = price * (1 + dK);
          trend = -1;
       }
    } else {
      if (trend <= 0) {
         if (Close[bar] < price) { price = Close[bar]; }
         value = price * (1 + dK);
         if (Close[bar] > value)
         {
             price = Close[bar];
            value = price * (1 - dK);
            trend = 1;
         }
      }
    }

   if (trend == -1) { Buffer1[bar]=value; }
   if (trend == 1) { Buffer2[bar]=value; }
//----

   bar--;
   }
   return(0);
  }
//+------------------------------------------------------------------+
Comments