my_Daily_High_Low
Download script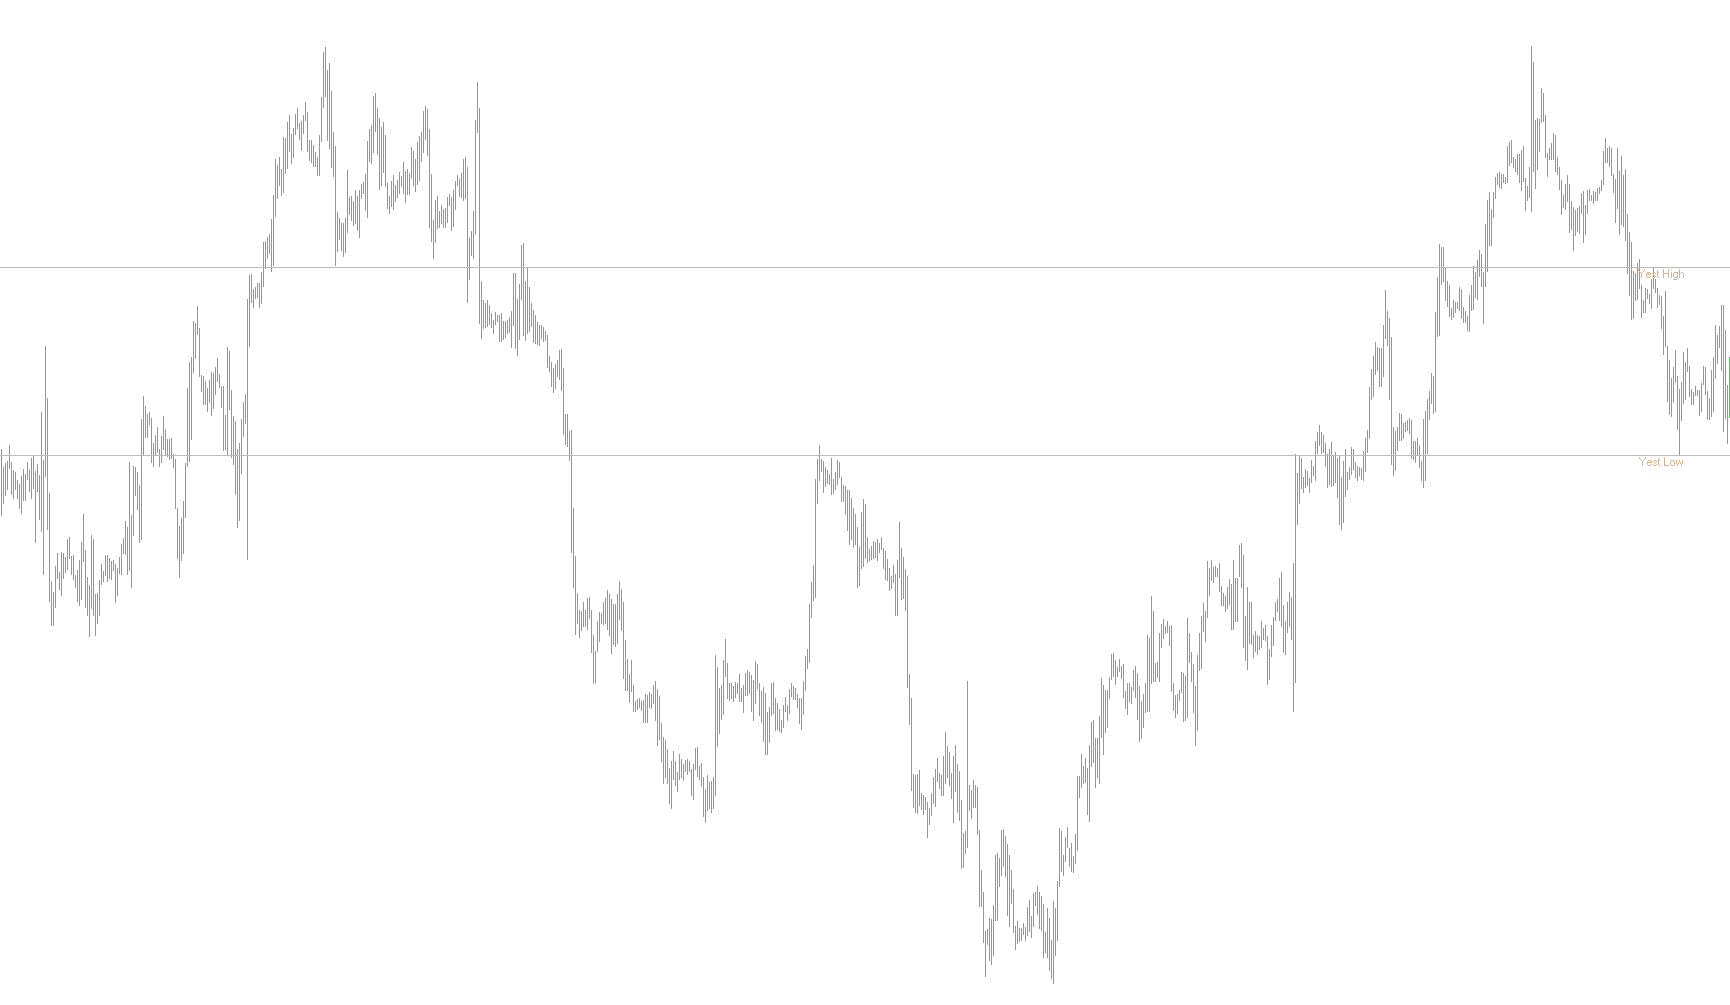
This script is designed to provide traders with a clear visual reference of the previous day's price action directly on their trading charts. By automatically identifying and plotting key historical price levels, it helps traders establish significant support and resistance boundaries for their current trading session.
How it Works
The logic follows a straightforward three-step process to ensure that your chart remains updated with accurate information:
1. Data Retrieval The script connects to the market data to specifically look at the Daily (D1) timeframe. It scans the completed price history from the previous day to identify two specific data points: the highest price reached and the lowest price reached during that 24-hour period.
2. Automatic Calculation Once the script identifies yesterday's high and low, it stores these values as active reference points. Rather than requiring manual input from the user, the script performs this calculation instantly every time the chart updates, ensuring the data is always current relative to the passage of time.
3. Visual Mapping The final step is the visual representation on your trading screen. The script handles three distinct visual elements:
- Horizontal Lines: It draws two solid horizontal lines across the chart that represent the exact price levels of yesterday’s high and low. These serve as permanent visual guides for identifying where the market might react or pull back.
- Text Labels: It places clear text markers (labeled "Yest High" and "Yest Low") on the chart. This removes any ambiguity, allowing you to see at a glance which line corresponds to which price level.
- Dynamic Positioning: The script is programmed to manage these objects intelligently. If the lines or labels already exist, it moves them to the correct position; if they do not exist (such as when first loading the chart), it creates them automatically.
Key Benefits for Traders
By automating this process, the script eliminates the need for manual price checking across different timeframes. It provides a "clean" workspace where the most relevant historical boundaries are always visible, allowing you to focus on identifying current market trends and potential entry points based on yesterday's range.
//+------------------------------------------------------------------+
//|                                               Daily_High_Low.mq4 |
//|                                       Copyright © Terry Nicholls |
//+------------------------------------------------------------------+
#property copyright "Copyright © Terry Nicholls"

// Parameters

#property indicator_chart_window

extern int TimeZoneOfData = 0; // GMT

double yesterday_high=0;
double yesterday_low=0;

double rates_d1[2][6];
double dlyh;
double dlyl;

//+------------------------------------------------------------------+
//| Custom indicator initialization function                         |
//+------------------------------------------------------------------+

int init()
  {

// Indicators

dlyh=0; dlyl=0;

   return(0);
  }

//+------------------------------------------------------------------+
//| Custom indicator deinitialization function                       |
//+------------------------------------------------------------------+

int deinit()
  {

ObjectDelete("dlyh Label");
ObjectDelete("dlyh Line");
ObjectDelete("dlyl Label");
ObjectDelete("dlyl Line");

   return(0);
  }

//+------------------------------------------------------------------+
//| Custom indicator iteration function                              |
//+------------------------------------------------------------------+

int start()
  {

// Get new Daily prices

ArrayCopyRates(rates_d1, Symbol(), PERIOD_D1);

yesterday_high = rates_d1[1][3];
yesterday_low = rates_d1[1][2];

// Calculate Daily High/Low lines

dlyh = yesterday_high;
dlyl = yesterday_low;

// Uncomment the line below to display the data at the top of your chart

// Comment ("Yesterday's High = ",yesterday_high,"  Yesterday's Low = ",yesterday_low);

// Set Daily High/Low line labels on chart window

      if(ObjectFind("dlyh label") != 0)
      {
      ObjectCreate("dlyh label", OBJ_TEXT, 0, Time[15], dlyh);
      ObjectSetText("dlyh label", "Yest High", 8, "ArialBlack", Tan);
      }
      else
      {
      ObjectMove("dlyh label", 0, Time[35], dlyh);
      }

      if(ObjectFind("dlyl label") != 0)
      {
      ObjectCreate("dlyl label", OBJ_TEXT, 0, Time[8], dlyl);
      ObjectSetText("dlyl label", "Yest Low", 8, "ArialBlack", Tan);
      }
      else
      {
      ObjectMove("dlyl label", 0, Time[35], dlyl);
      }

// Draw Yesterday's High/Low lines on chart

      if(ObjectFind("dlyh line") != 0)
      {
      ObjectCreate("dlyh line", OBJ_HLINE, 0, Time[40], dlyh);
      ObjectSet("dlyh line", OBJPROP_STYLE, STYLE_SOLID);
      ObjectSet("dlyh line", OBJPROP_WIDTH, 1);
      ObjectSet("dlyh line", OBJPROP_COLOR, Tan);
      }
      else
      {
      ObjectMove("dlyh line", 0, Time[40], dlyh);
      }

      if(ObjectFind("dlyl line") != 0)
      {
      ObjectCreate("dlyl line", OBJ_HLINE, 0, Time[40], dlyl);
      ObjectSet("dlyl line", OBJPROP_STYLE, STYLE_SOLID);
      ObjectSet("dlyh line", OBJPROP_WIDTH, 1);
      ObjectSet("dlyl line", OBJPROP_COLOR, Tan);
      }
      else
      {
      ObjectMove("dlyl line", 0, Time[40], dlyl);
      }

   return(0); // End program

  }

//+------------------------------------------------------------------+
Comments