nd2
Download script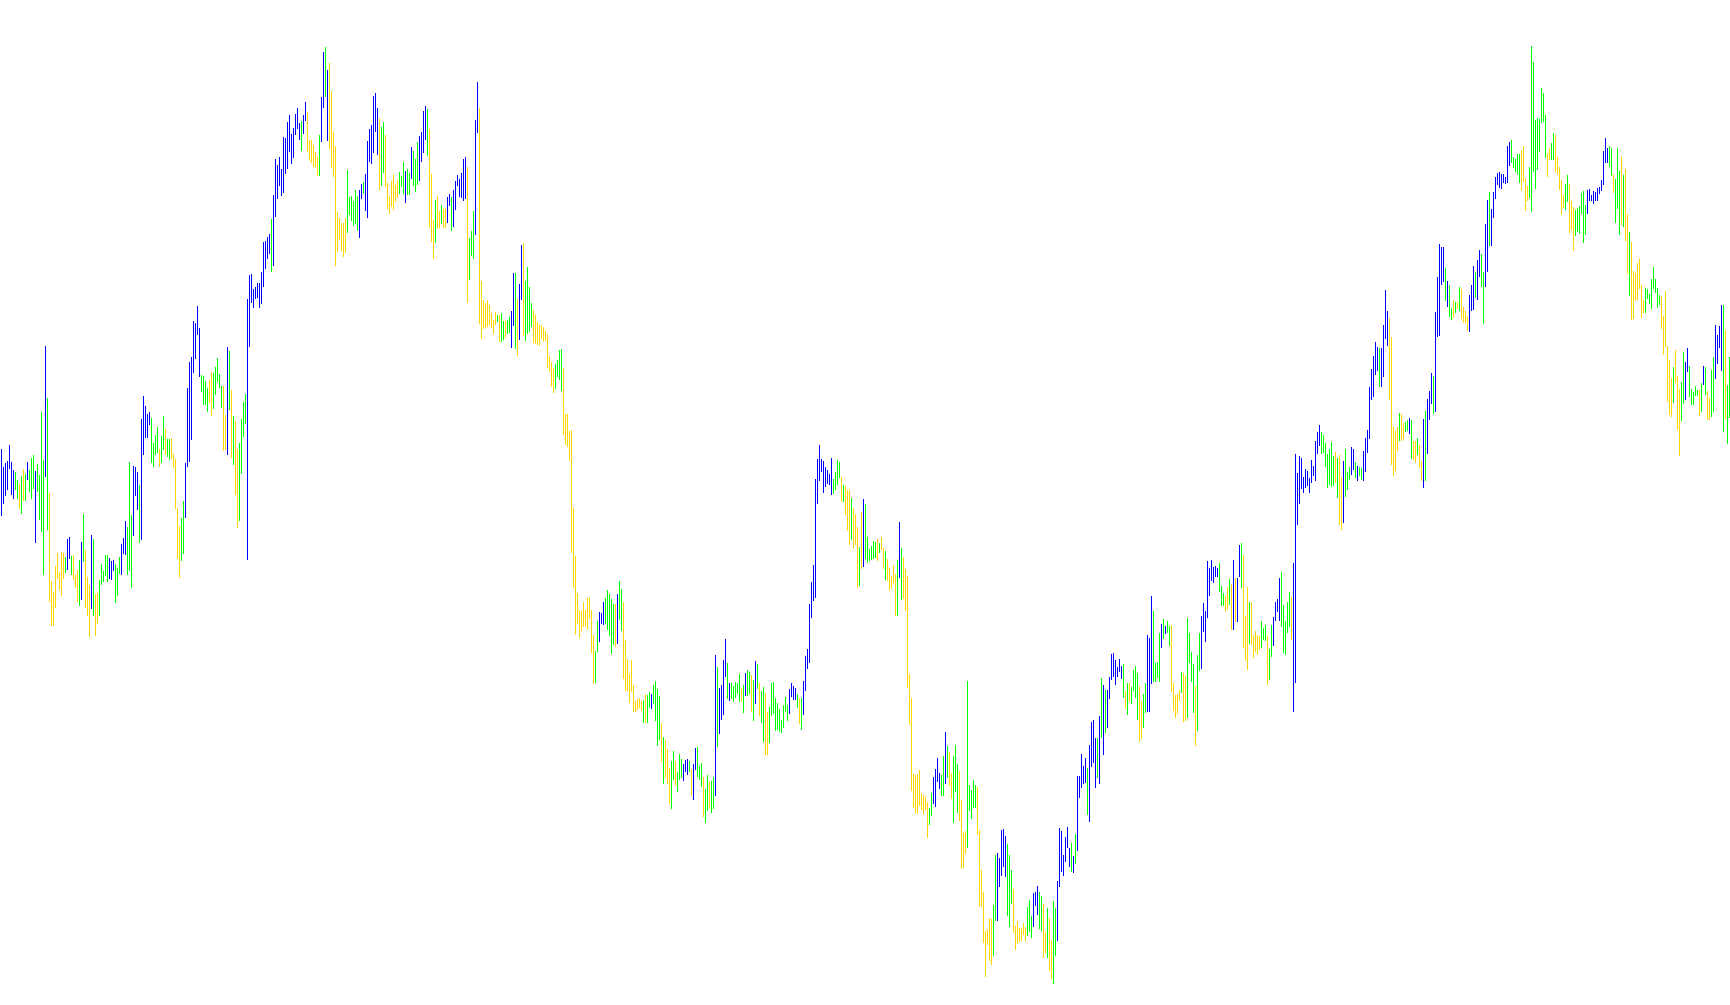
This tool is designed to analyze market price movements and provide visual signals regarding potential trends on a trading chart. By processing historical price data, it identifies specific patterns of momentum and volatility to help users distinguish between different market environments.
Core Logic Overview
The script functions by evaluating the relationship between current price action and established historical averages. It focuses on three main components:
1. Volatility and Range Analysis The tool first calculates a "normal" price range by looking at the high and low points of recent bars (candles). It determines how much the market typically moves over a short period. This baseline is essential for the script to differentiate between standard market noise and significant, meaningful price movements.
2. Momentum Detection Once the average range is established, the logic searches for "breakout" behaviors. It looks for two specific types of movement:
- Price Gaps: It checks if the current opening price is significantly different from the previous closing price relative to the calculated range.
- Extended Swings: It identifies instances where the price moves significantly further than expected in a short window of time.
If the script detects these significant movements, it adjusts its internal sensitivity settings. This allows the indicator to react more dynamically during high-activity periods while remaining stable during quieter markets.
3. Trend Signaling via Percentile Positioning The final layer of logic uses a momentum oscillator (WPR) to determine where the current price sits relative to its recent history. It converts this into a percentage-based value:
- Upper Bound Signals: When the price moves into an upper percentile of its range, the script identifies a potential bullish trend.
- Lower Bound Signals: When the price drops into a lower percentile, it identifies a potential bearish trend.
Visual Output
The results are displayed as two distinct histogram lines on your chart (Red and Blue). These visual markers act as "boundaries" or "signals." When the logic detects a specific trend direction based on the calculations above, it plots these lines at the high or low points of the candles to give the trader a clear visual cue of the current market bias.
//+-----------------------------------------------------------------------+
//|                                                       BrainTrend2.mq4 |
//|                                   Copyright © 2005. Alejandro Galindo |
//|                                                   http://elCactus.com |
//|         ASCTrend1 modified to generate similar signals to BrainTrend1 |
//|           	Author := C0Rpus - big thanks CHANGE2002, STEPAN and SERSH |
//|	                                 Notes := ASCTrend1 3.0 Open Source |
//+-----------------------------------------------------------------------+

#property indicator_chart_window
#property indicator_buffers 2
#property indicator_color1 Red
#property indicator_color2 Blue

//---- input parameters
extern int RISK=3;
extern int CountBars=5000;

//---- buffers
double Buffer1[];
double Buffer2[];

//+------------------------------------------------------------------+
//| Custom indicator initialization function                         |
//+------------------------------------------------------------------+
int init()
  {
//---- indicator line
   IndicatorBuffers(2);
   SetIndexStyle(0,DRAW_HISTOGRAM,0,1);
   SetIndexStyle(1,DRAW_HISTOGRAM,0,1);
   SetIndexBuffer(0,Buffer1);
   SetIndexBuffer(1,Buffer2);

//----
   return(0);
  }
//+------------------------------------------------------------------+
//| ASCTrend1                                                  |
//+------------------------------------------------------------------+
int start()
  {
   if (CountBars>=Bars) CountBars=Bars;
   SetIndexDrawBegin(0,Bars-CountBars+11+1);
   SetIndexDrawBegin(1,Bars-CountBars+11+1);
   int i,shift,counted_bars=IndicatorCounted();
   int Counter,i1,value10,value11;
   double value1,x1,x2;
   double value2,value3;
   double TrueCount,Range,AvgRange,MRO1,MRO2;

   value10=3+RISK*2;
   x1=67+RISK;
   x2=33-RISK;
   value11=value10;
//----
   if(Bars<=value11+1) return(0);
//---- initial zero
   if(counted_bars<value11+1)
   {
      for(i=1;i<=0;i++) Buffer1[CountBars-i]=0.0;
      for(i=1;i<=0;i++) Buffer2[CountBars-i]=0.0;
   }
//----
   shift=CountBars-11-1;
   while(shift>=0)
     {

   Counter=shift;
	Range=0.0;
	AvgRange=0.0;
	for (Counter=shift; Counter<=shift+9; Counter++) AvgRange=AvgRange+MathAbs(High[Counter]-Low[Counter]);

	Range=AvgRange/10;
	Counter=shift;
	TrueCount=0;
	while (Counter<shift+9 && TrueCount<1)
		{if (MathAbs(Open[Counter]-Close[Counter+1])>=Range*2.0) TrueCount=TrueCount+1;
		Counter=Counter+1;
		}
	if (TrueCount>=1) {MRO1=Counter;} else {MRO1=-1;}
	Counter=shift;
	TrueCount=0;
	while (Counter<shift+6 && TrueCount<1)
		{if (MathAbs(Close[Counter+3]-Close[Counter])>=Range*4.6) TrueCount=TrueCount+1;
		Counter=Counter+1;
		}
	if (TrueCount>=1) {MRO2=Counter;} else {MRO2=-1;}
	if (MRO1>-1) {value11=3;} else {value11=value10;}
	if (MRO2>-1) {value11=4;} else {value11=value10;}
	value2=100-MathAbs(iWPR(NULL,0,value11,shift)); // PercentR(value11=9)
   Buffer1[shift]=0;
	Buffer2[shift]=0;
	if (value2>x1)
		{
		Buffer1[shift]=Low[shift]; Buffer2[shift]=High[shift];
		}
	if (value2<x2)
		{
		Buffer1[shift]=High[shift]; Buffer2[shift]=Low[shift];
		}

      shift--;
     }

   return(0);
  }
//+------------------------------------------------------------------+
Comments