NavelSMA_v1
Download script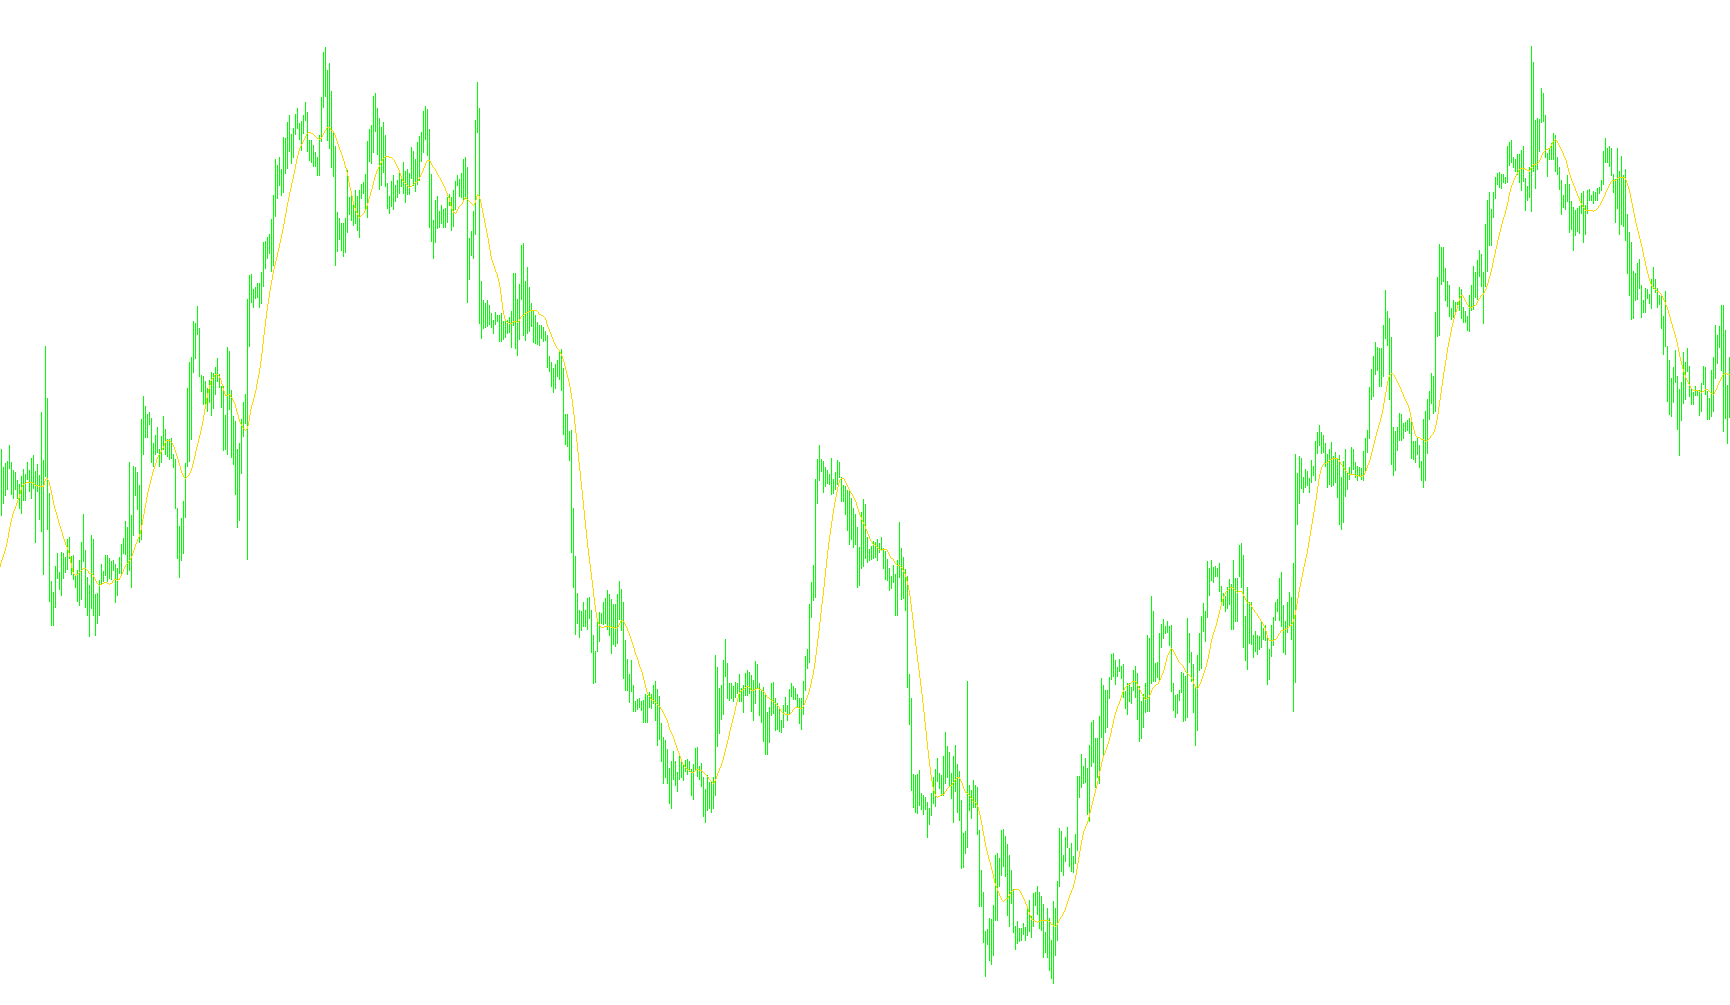
This custom indicator is designed to provide a smoothed visual representation of market trends by calculating a specialized moving average. Unlike standard indicators that rely solely on closing prices, this script uses a proprietary weighted calculation to determine the "core" price of a candle.
How the Logic Works
1. Custom Price Calculation (The "Navel" Formula) The foundation of this indicator is a unique price point it identifies for every individual candle on the chart. Instead of looking only at where a candle finished, it takes a weighted average of four key data points:
- The Closing Price (given the highest priority)
- The Opening Price
- The High Point
- The Low Point
By blending these four values into a single representative price, the indicator aims to provide a more holistic view of market activity during each period.
2. Moving Average Smoothing Once the script establishes this unique price for every candle, it applies a moving average logic across a user-defined period (defaulting to 13). It looks back at a specific number of candles, totals their weighted prices, and divides them by the period length to create a smooth line.
3. Dynamic Updating The script is programmed to continuously recalculate this value as new data arrives. As a new candle forms, it drops the oldest calculation from the total and adds the newest one, allowing the indicator line to flow smoothly across your chart in real-time.
Key Features for Users
- Customizable Sensitivity: You can adjust the "MA_Period" to make the line smoother (longer period) or more reactive to sudden price changes (shorter period).
- Visual Shift: The script includes a "Shift" parameter, which allows you to move the resulting line forward or backward on the chart for better alignment with your trading strategy.
- Trend Visualization: By converting volatile price action into a smoothed red line based on weighted averages, it helps filter out "market noise," making it easier to identify the underlying direction of the trend.
//+------------------------------------------------------------------+
//|                                                     NavelSMA.mq4 |
//+------------------------------------------------------------------+
//|   Íà áàçå (êîä ïîñòàðàëñÿ ñîõðàíèòü, êàê â îðèãèíàëå):
//|                                        Custom Moving Average.mq4
//|                      Copyright © 2004, MetaQuotes Software Corp.
//|                                       http://www.metaquotes.net/
//|   Âûçîâ:
//|   Val=iCustom(symbol,
//|               timeframe,
//|               "NavelSMA",
//|               MA_Period,
//|               MA_Shift,
//|               0,
//|               NumBar);
//+------------------------------------------------------------------+
#property copyright "Copyright © 2008, Bookkeeper"
#property link      "yuzefovich@gmail.com"

#property indicator_chart_window
#property indicator_buffers 1
#property indicator_color1 Red
extern int MA_Period=13;
extern int MA_Shift=0;
double ExtMapBuffer[];
int ExtCountedBars=0;
//+------------------------------------------------------------------+
int init()
  {
   SetIndexStyle(0,DRAW_LINE);
   SetIndexShift(0,MA_Shift);
   if(MA_Period<2) MA_Period=13;
   SetIndexBuffer(0,ExtMapBuffer);
   return(0);
  }
//+------------------------------------------------------------------+
//|                                                                  |
//+------------------------------------------------------------------+
int start()
  {
   if(Bars<=MA_Period) return(0);
   ExtCountedBars=IndicatorCounted();
   if (ExtCountedBars<0) return(-1);
   if (ExtCountedBars>0) ExtCountedBars--;
   double sum=0;
   int    i,pos=Bars-ExtCountedBars-1;
   if(pos<MA_Period) pos=MA_Period;
   for(i=1;i<MA_Period;i++,pos--)
      sum+=Navel(pos);
   while(pos>=0)
     {
      sum+=Navel(pos);
      ExtMapBuffer[pos]=sum/MA_Period;
	   sum-=Navel(pos+MA_Period-1);
 	   pos--;
     }
/*


   double pr=2.0/(MA_Period+1);
   int    pos=Bars-2;
   if(ExtCountedBars>2) pos=Bars-ExtCountedBars-1;
   while(pos>=0)
     {
      if(pos==Bars-2) ExtMapBuffer[pos+1]=Navel(pos+1);
      ExtMapBuffer[pos]=Navel(pos)*pr+ExtMapBuffer[pos+1]*(1-pr);
 	   pos--;
     }
*/
   return(0);
  }
//+------------------------------------------------------------------+
double Navel(int bar)
{
   double price=(Close[bar]*5+Open[bar]*2+High[bar]+Low[bar])/9;
   return(price);
}
Comments