Momentum-ZL
Download script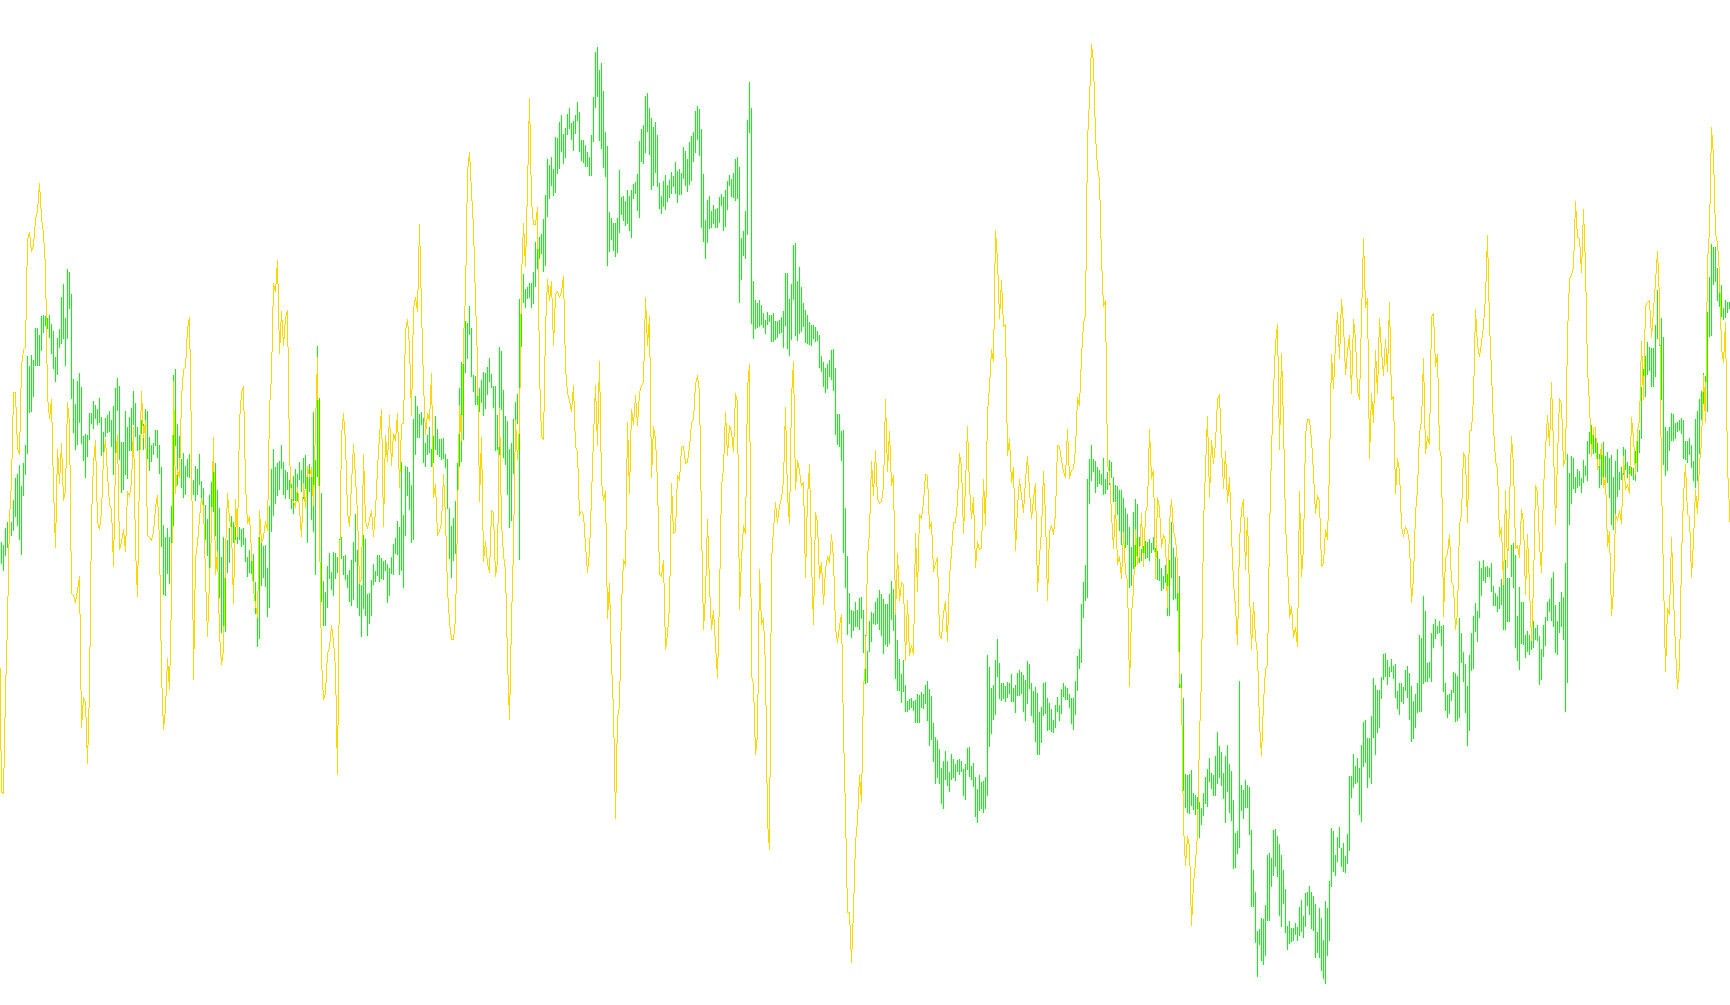
This tool is designed to help traders visualize the "velocity" or strength behind a price movement. In simpler terms, while standard charts tell you where the price is, this indicator helps you understand how fast and in what direction it is moving relative to a specific point in the past.
How the Logic Works
1. The Time Window (Momentum Period) The script looks at a user-defined period of time (the "Momentum Period"). If you set this to 10, the tool compares the current price against the price from 10 bars ago. This creates a baseline for measuring how much progress the market has made over that specific interval.
2. Calculating the Movement The indicator measures the difference between the current closing price and the closing price from the beginning of that period. By subtracting these two points, the script identifies the total "distance" traveled by the market.
3. The Normalization Adjustment A unique feature of this specific script is that it applies a mathematical adjustment (subtracting 100) to the raw momentum calculation. This shifts the visual data on your chart, effectively centering or offsetting the line so that it interacts specifically with the "zero" level on your indicator window.
4. Visual Representation The result is displayed as a continuous line in a separate window below your main price chart:
- Positive Momentum: When the line moves above the zero level, it suggests that the price is currently higher than it was at the start of the look-back period, indicating upward strength.
- Negative Momentum: When the line drops below the zero level, it indicates that the price is lower than it was at the start of the period, signaling downward pressure.
Summary for Traders
Essentially, this script filters out the "noise" of minor price ticks to show you the broader trend of the current momentum. It allows you to see if a move is gaining strength (the line moving higher/further away from zero) or losing steam (the line flattening out or curving back toward zero), helping you identify potential reversals or continuations before they become obvious on the main price chart.
//+------------------------------------------------------------------+
//|                                                     Momentum.mq4 |
//|                      Copyright © 2004, MetaQuotes Software Corp. |
//|                                       http://www.metaquotes.net/ |
//+------------------------------------------------------------------+
#property copyright "Copyright © 2004, MetaQuotes Software Corp."
#property link      "http: //www.metaquotes.net/"

#property indicator_separate_window
#property indicator_buffers 1
#property indicator_color1 DodgerBlue
#property indicator_level1 0.0
#property indicator_levelcolor Red
#property indicator_levelwidth 1
#property indicator_levelstyle STYLE_SOLID

//---- input parameters
extern int MomPeriod = 10;

//---- buffers
double MomBuffer[];

//+------------------------------------------------------------------+
//| Custom indicator initialization function                         |
//+------------------------------------------------------------------+
int init() {
    string short_name;
//---- indicator line
    SetIndexStyle( 0, DRAW_LINE );
    SetIndexBuffer( 0, MomBuffer );
//---- name for DataWindow and indicator subwindow label
    short_name = "Momentum-ZL(" + MomPeriod + ")";
    IndicatorShortName( short_name );
    SetIndexLabel( 0, short_name );
//----
    SetIndexDrawBegin( 0, MomPeriod );
//----
    return( 0 );
}

//+------------------------------------------------------------------+
//| Momentum                                                         |
//+------------------------------------------------------------------+
int start() {
    int i, counted_bars = IndicatorCounted();

//----
    if ( Bars <= MomPeriod ) {
        return( 0 );
    }

//---- initial zero
    if ( counted_bars < 1 ) {
        for ( i = 1; i <= MomPeriod; i++ ) {
            MomBuffer[Bars - i] = 0.0;
        }
    }
//----
    i = Bars - MomPeriod - 1;

    if ( counted_bars >= MomPeriod ) {
        i = Bars - counted_bars - 1;
    }

    while ( i >= 0 ) {
        MomBuffer[i] = iMomentum( NULL, 0, MomPeriod, PRICE_CLOSE, i ) - 100.0;
        i--;
    }
    return( 0 );
}

//+------------------------------------------------------------------+
Comments