Momentum
Download script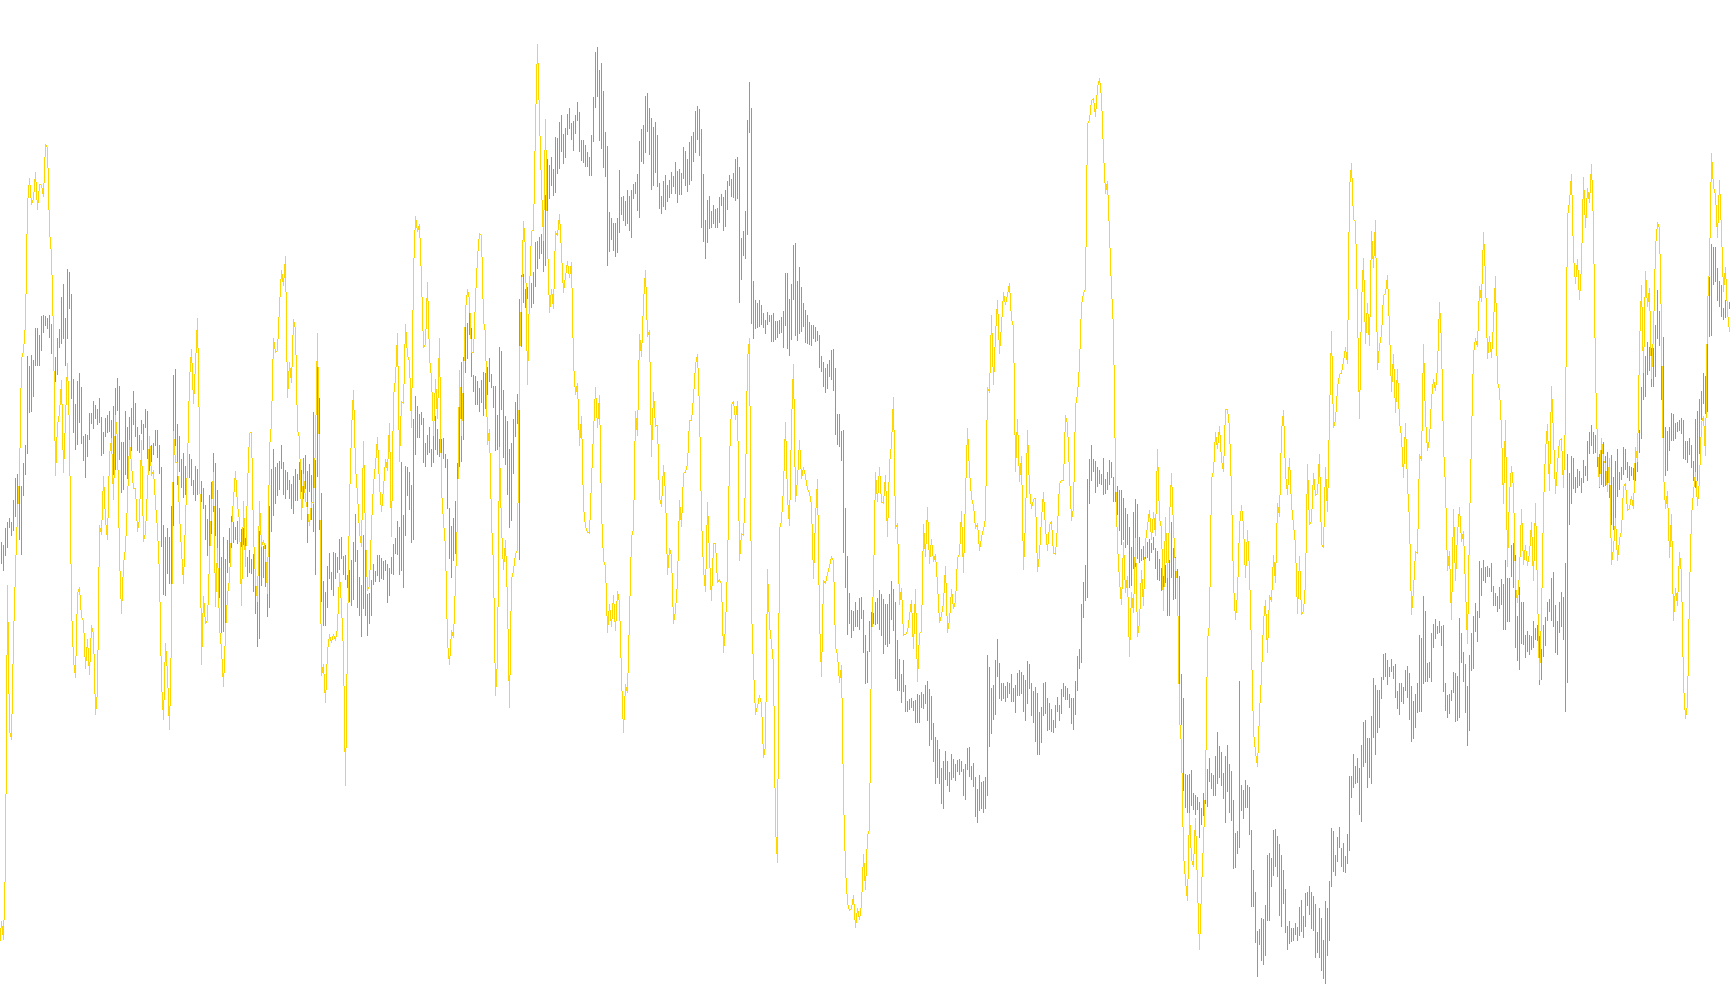
This Momentum indicator is designed to help traders visualize the strength and speed of price movements over a specific period. Instead of just looking at where the price is currently located, this tool helps you understand how much the price has changed relative to where it was in the past.
How the Logic Works
The script functions by comparing the current closing price of an asset (like a currency pair or stock) against its closing price from a set number of bars ago. By default, this window is set to 14 periods.
To produce the final value shown on your chart, the tool follows these steps:
- Price Comparison: It takes the current price and divides it by the price recorded 14 periods ago.
- Percentage Scaling: It multiplies that result by 100 to convert the raw data into a more readable percentage-based format.
- Visual Representation: The result is plotted as a continuous line in a separate window below your main price chart.
How to Interpret the Results
The indicator provides a snapshot of "velocity" in the market:
- Positive Growth: When the line is above zero and moving upward, it indicates that the current price is higher than it was 14 periods ago, suggesting bullish momentum.
- Negative Growth: When the line drops below zero, it signifies that the current price has fallen relative to its past position, indicating bearish momentum.
- Trend Strength: The steeper the slope of the line, the faster the price is moving in that specific direction. A flattening line suggests that the current price movement is losing speed.
By using this tool, you can better identify whether a market trend is accelerating, slowing down, or potentially reaching a turning point based on its historical momentum.
//+------------------------------------------------------------------+
//|                                                     Momentum.mq4 |
//|                      Copyright © 2004, MetaQuotes Software Corp. |
//|                                       http://www.metaquotes.net/ |
//+------------------------------------------------------------------+
#property copyright "Copyright © 2004, MetaQuotes Software Corp."
#property link      "http://www.metaquotes.net/"

#property indicator_separate_window
#property indicator_buffers 1
#property indicator_color1 DodgerBlue
//---- input parameters
extern int MomPeriod=14;
//---- buffers
double MomBuffer[];
//+------------------------------------------------------------------+
//| Custom indicator initialization function                         |
//+------------------------------------------------------------------+
int init()
  {
   string short_name;
//---- indicator line
   SetIndexStyle(0,DRAW_LINE);
   SetIndexBuffer(0,MomBuffer);
//---- name for DataWindow and indicator subwindow label
   short_name="Mom("+MomPeriod+")";
   IndicatorShortName(short_name);
   SetIndexLabel(0,short_name);
//----
   SetIndexDrawBegin(0,MomPeriod);
//----
   return(0);
  }
//+------------------------------------------------------------------+
//| Momentum                                                         |
//+------------------------------------------------------------------+
int start()
  {
   int i,counted_bars=IndicatorCounted();
//----
   if(Bars<=MomPeriod) return(0);
//---- initial zero
   if(counted_bars<1)
      for(i=1;i<=MomPeriod;i++) MomBuffer[Bars-i]=0.0;
//----
   i=Bars-MomPeriod-1;
   if(counted_bars>=MomPeriod) i=Bars-counted_bars-1;
   while(i>=0)
     {
      MomBuffer[i]=Close[i]*100/Close[i+MomPeriod];
      i--;
     }
   return(0);
  }
//+------------------------------------------------------------------+
Comments