Momentum_v1
Download script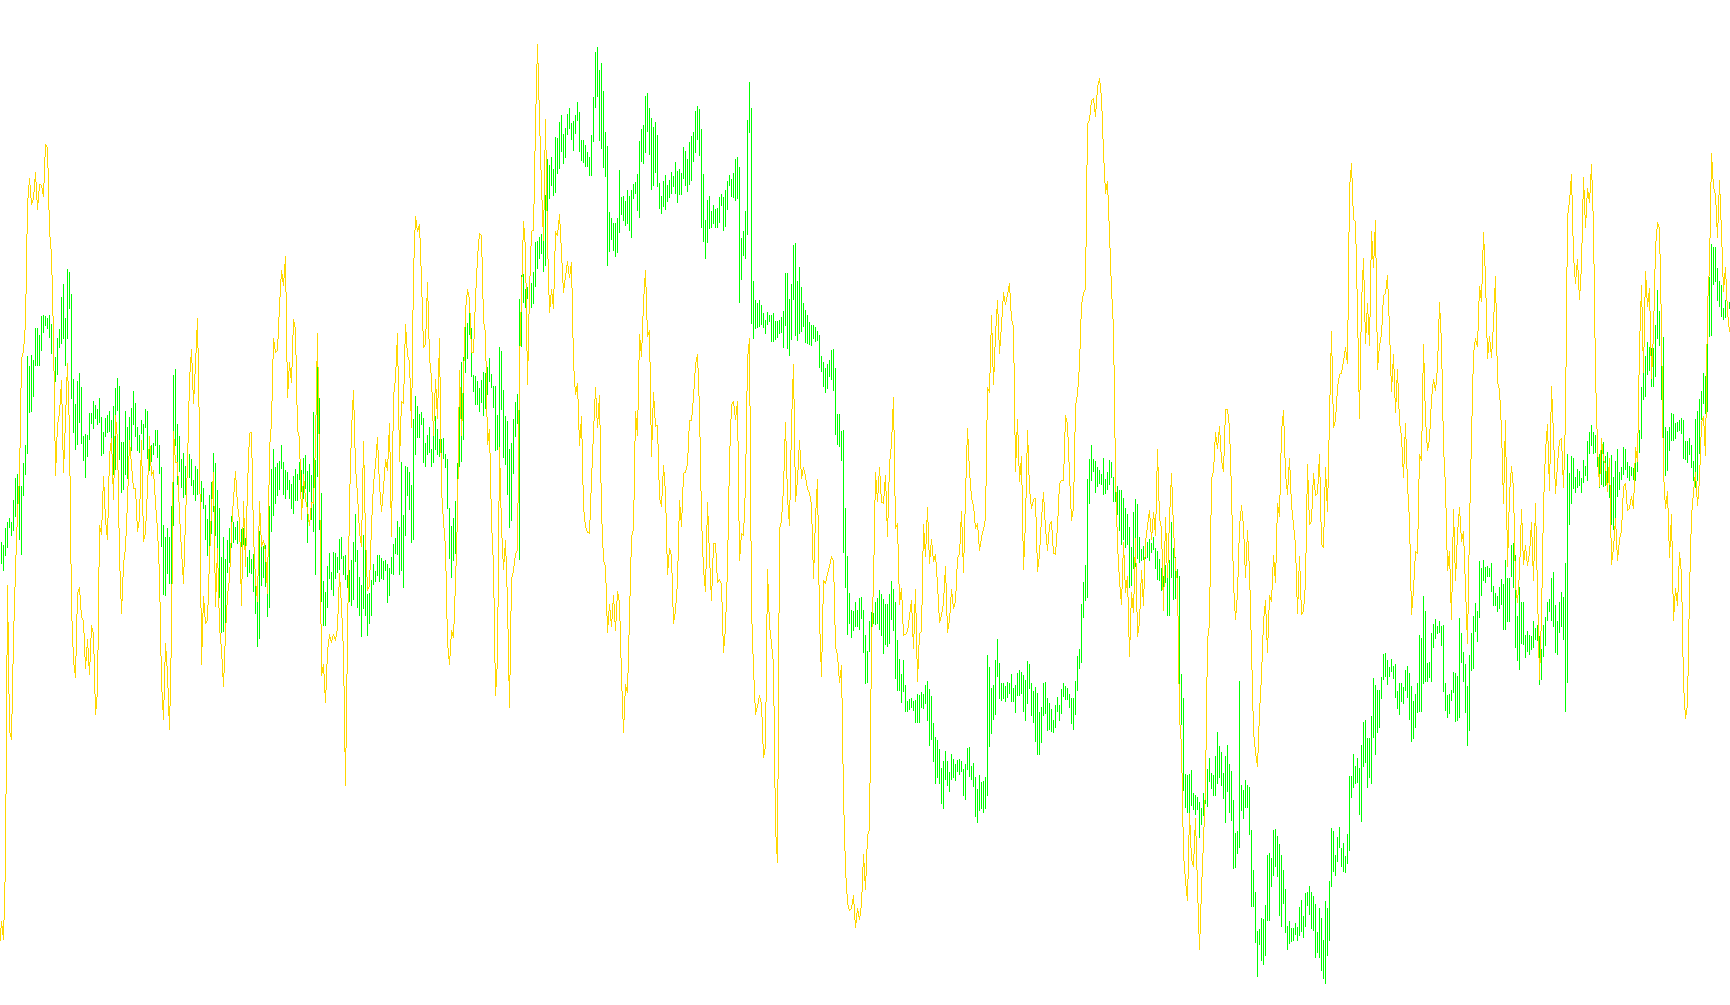
This Momentum indicator is designed to measure the speed and strength of price movements over a specific period. Unlike some indicators that show the absolute price, this tool focuses on the rate of change, helping traders visualize whether an asset is gaining or losing energy relative to its past performance.
How it Works
The logic operates by comparing the current closing price of a financial instrument against its closing price from a predetermined number of days (or bars) ago. By taking these two data points and calculating the ratio between them, the indicator produces a percentage-based value.
For example, if you set the period to 14, the script looks back at what the price was 14 periods ago and compares it to where the price is right now.
Key Features
- Relative Performance: Instead of showing just the raw price, it highlights the "momentum." This allows you to see if a move is accelerating or slowing down.
- Visual Representation: The result is displayed as a continuous line in a separate window below your main chart. This keeps the primary price action clear while providing a dedicated space for trend analysis.
- Dynamic Scaling: By multiplying the calculation by 100, the indicator converts the price change into a percentage format. This makes it easier to compare different assets (like gold vs. currency pairs) because they are all measured on a relative scale.
Practical Application
Traders use this logic to identify trends. When the line moves upward, it suggests that the current price is higher than it was in the past, indicating bullish momentum. Conversely, a downward trend suggests that the price is weakening compared to its previous levels. It essentially acts as a "speedometer" for the market's direction.
/*-----------------------------+
|			       |
| Shared by www.Aptrafx.com    |
|			       |
+------------------------------*/

//+------------------------------------------------------------------+
//|                                                     Momentum.mq4 |
//|                      Copyright © 2004, MetaQuotes Software Corp. |
//|                                       http://www.metaquotes.net/ |
//+------------------------------------------------------------------+
#property copyright "Copyright © 2004, MetaQuotes Software Corp."
#property link      "http://www.metaquotes.net/"

#property indicator_separate_window
#property indicator_buffers 1
#property indicator_color1 DodgerBlue
//---- input parameters
extern int MomPeriod=14;
//---- buffers
double MomBuffer[];
//+------------------------------------------------------------------+
//| Custom indicator initialization function                         |
//+------------------------------------------------------------------+
int init()
  {
   string short_name;
//---- indicator line
   SetIndexStyle(0,DRAW_LINE);
   SetIndexBuffer(0,MomBuffer);
//---- name for DataWindow and indicator subwindow label
   short_name="Mom("+MomPeriod+")";
   IndicatorShortName(short_name);
   SetIndexLabel(0,short_name);
//----
   SetIndexDrawBegin(0,MomPeriod);
//----
   return(0);
  }
//+------------------------------------------------------------------+
//| Momentum                                                         |
//+------------------------------------------------------------------+
int start()
  {
   int i,counted_bars=IndicatorCounted();
//----
   if(Bars<=MomPeriod) return(0);
//---- initial zero
   if(counted_bars<1)
      for(i=1;i<=MomPeriod;i++) MomBuffer[Bars-i]=0.0;
//----
   i=Bars-MomPeriod-1;
   if(counted_bars>=MomPeriod) i=Bars-counted_bars-1;
   while(i>=0)
     {
      MomBuffer[i]=Close[i]*100/Close[i+MomPeriod];
      i--;
     }
   return(0);
  }
//+------------------------------------------------------------------+
Comments