MonthlyPivot_mids
Download script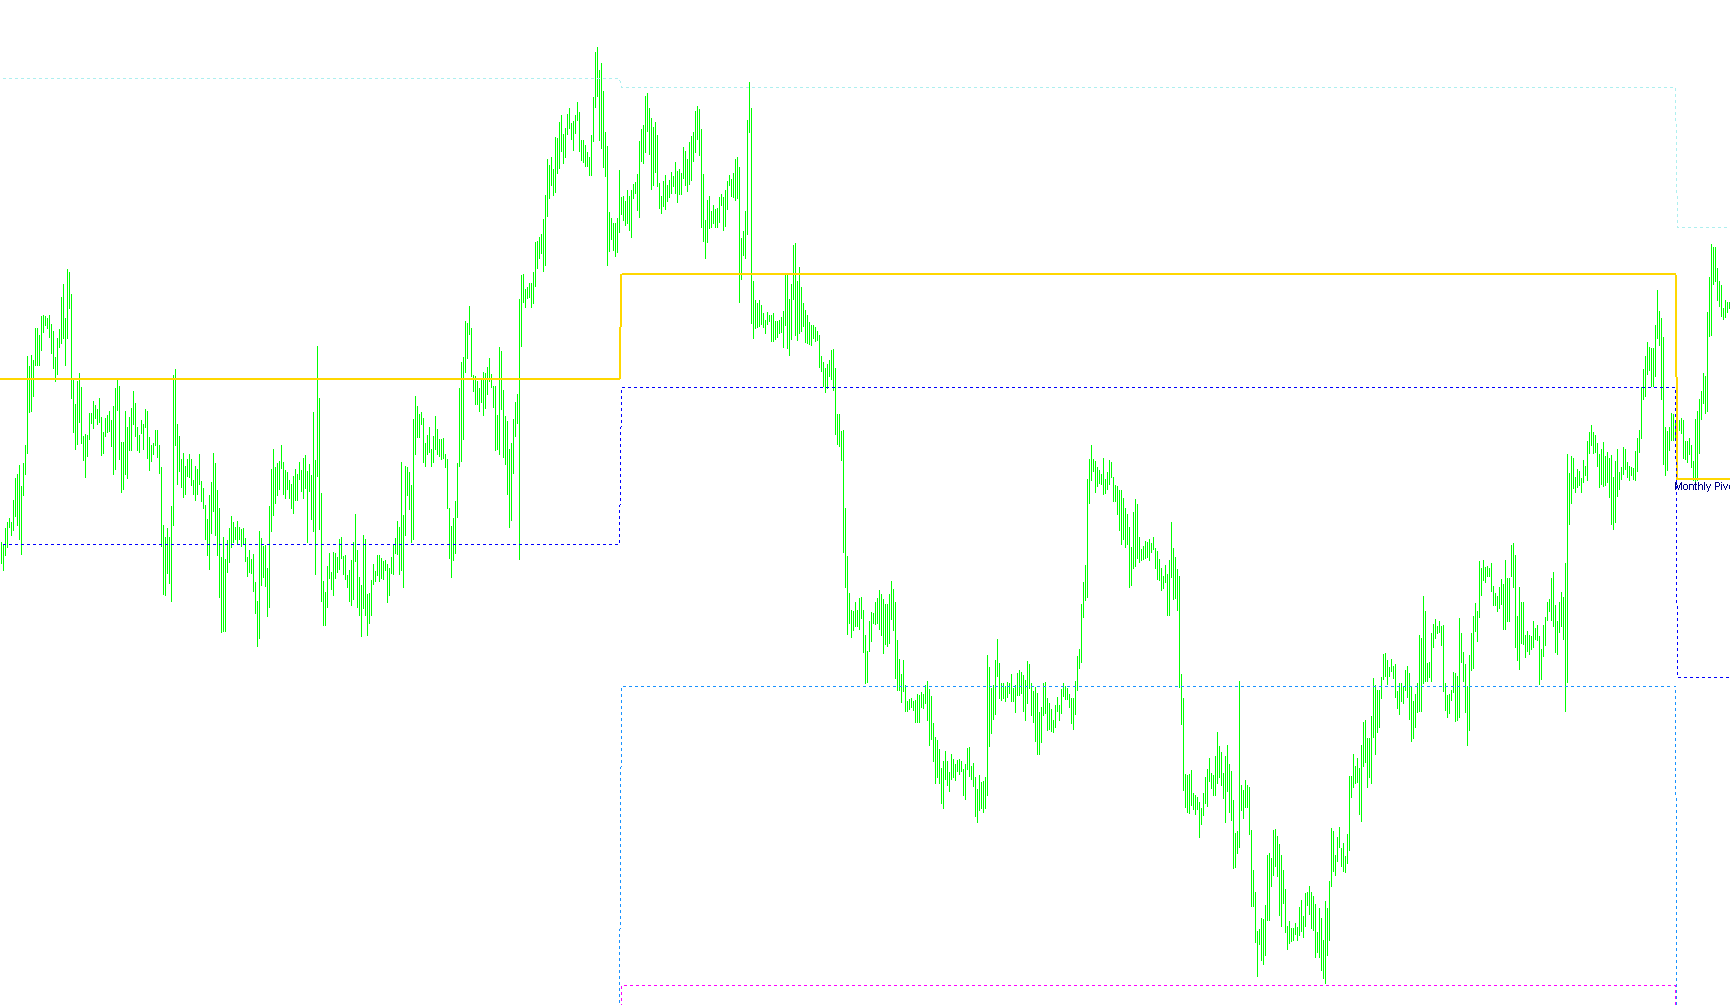
This script is designed to automatically calculate and display key price levels on your trading charts, specifically focusing on "Monthly Pivot Points." These points are essential tools for traders who want to identify potential areas of support (where prices may stop falling) and resistance (where prices may stop rising) based on the preceding month's market activity.
Core Functionality
The logic is designed to transition every month, automatically capturing the high, low, and closing prices of the previous month to calculate a series of seven distinct price levels for the current month. These are displayed as horizontal lines on your chart:
- Monthly Pivot Point: The central equilibrium level for the month.
- Support Levels (S1, S2, S3): Three descending levels that indicate potential "floors."
- Resistance Levels (R1, R2, R3): Three ascending levels that indicate potential "ceilings."
How the Logic Works
The script operates using a specific set of rules to ensure accuracy across different timeframes:
1. Timeframe Compatibility To maintain the integrity of monthly data, the script is programmed to function only on higher-level charts (specifically those larger than or equal to the Daily timeframe). This prevents the monthly levels from becoming cluttered or distorted on smaller, more volatile minute-by-minute charts.
2. Data Identification & Detection The logic scans historical price data to identify the transition between months. It specifically looks for the period where the current month begins (the first three days of a new month) compared to the final days of the previous month. This ensures that the calculations are based on completed monthly cycles rather than "live" fluctuating data from the middle of a month.
3. The Calculation Process Once it identifies the start of a new month, the script gathers four key pieces of information:
- The Highest Price reached in the previous month.
- The Lowest Price reached in the previous month.
- The Closing Price of the previous month.
- The Opening Price of the current month.
It then applies a mathematical formula to these figures to generate the Pivot Point and the three tiers of Support and Resistance levels.
4. Dynamic Updating As the market moves forward, the script continuously tracks the highest and lowest prices reached during the current month. While the primary pivot levels are set at the start of the month, the script ensures that all data points remain consistent and updated across your chart history, allowing you to see exactly how price action has behaved relative to those pre-calculated levels throughout the month.
Visual Output
The script provides a clean visual interface by drawing these levels as distinct lines on your screen. It also includes descriptive text labels (such as "mmS1" for Support 1 and "mmR1" for Resistance 1) so that you can immediately identify which price level is which without needing to guess their positions.
//+------------------------------------------------------------------+
//|                                                    Monthly Pivot |
//|                                    Copyright © 2006, Profitrader |
//|                                    Coded/Verified by Profitrader |
//+------------------------------------------------------------------+
#property copyright "Copyright © 2006, Profitrader."
#property link      "profitrader@inbox.ru"

#property indicator_chart_window
#property indicator_buffers 7
#property indicator_color1 Navy
#property indicator_color2 White
#property indicator_color3 White
#property indicator_color4 White
#property indicator_color5 White
#property indicator_color6 White
#property indicator_color7 White
//---- buffers
double PBuffer[];
double S1Buffer[];
double R1Buffer[];
double S2Buffer[];
double R2Buffer[];
double S3Buffer[];
double R3Buffer[];

double P,S1,R1,S2,R2,S3,R3,last_month_high,last_month_low,last_month_close,this_month_open;
//+------------------------------------------------------------------+
//| Custom indicator initialization function                         |
//+------------------------------------------------------------------+
int init()
  {
   SetIndexBuffer(0,PBuffer);
   SetIndexBuffer(1,S1Buffer);
   SetIndexBuffer(2,R1Buffer);
   SetIndexBuffer(3,S2Buffer);
   SetIndexBuffer(4,R2Buffer);
   SetIndexBuffer(5,S3Buffer);
   SetIndexBuffer(6,R3Buffer);
   SetIndexStyle(0,DRAW_LINE,0,2);
   SetIndexStyle(1,DRAW_LINE,2,1);
   SetIndexStyle(2,DRAW_LINE,2,1);
   SetIndexStyle(3,DRAW_LINE,2,1);
   SetIndexStyle(4,DRAW_LINE,2,1);
   SetIndexStyle(5,DRAW_LINE,2,1);
   SetIndexStyle(6,DRAW_LINE,2,1);
   SetIndexLabel(0,"Monthly Pivot Point");
   SetIndexLabel(1,"Monthly MidSupport 1");
   SetIndexLabel(2,"Monthly MidResistant 1");
   SetIndexLabel(3,"Monthly MidSupport 2");
   SetIndexLabel(4,"Monthly MidResistant 2");
   SetIndexLabel(5,"Monthly MidSupport 3");
   SetIndexLabel(6,"Monthly MidResistant 3");
   return(0);
  }
//+------------------------------------------------------------------+
//| Custor indicator deinitialization function                       |
//+------------------------------------------------------------------+
int deinit()
  {
   ObjectDelete("Monthly Pivot");
   ObjectDelete("Monthly MSup1");
   ObjectDelete("Monthly MRes1");
   ObjectDelete("Monthly MSup2");
   ObjectDelete("Monthly MRes2");
   ObjectDelete("Monthly MSup3");
   ObjectDelete("Monthly MRes3");
   return(0);
  }
//+------------------------------------------------------------------+
//| Custom indicator iteration function                              |
//+------------------------------------------------------------------+
int start()
  {
   int i,counted_bars=IndicatorCounted();
//---- check for possible errors
   if(counted_bars<0) return(-1);
//---- last counted bar will be recounted
   if(counted_bars>0) counted_bars--;
   int limit=Bars-counted_bars;

   if(Period()>PERIOD_D1) return(-1);
   if(counted_bars==0)
     {
      ObjectCreate("Monthly Pivot",OBJ_TEXT,0,0,0);
      ObjectSetText("Monthly Pivot","                            Monthly Pivot Point",8,"Arial",Navy);
      ObjectCreate("Monthly MSup1",OBJ_TEXT,0,0,0);
      ObjectSetText("Monthly MSup1","        mmS 1",8,"Arial",White);
      ObjectCreate("Monthly MRes1",OBJ_TEXT,0,0,0);
      ObjectSetText("Monthly MRes1","        mmR 1",8,"Arial",White);
      ObjectCreate("Monthly MSup2",OBJ_TEXT,0,0,0);
      ObjectSetText("Monthly MSup2","        mmS 2",8,"Arial",White);
      ObjectCreate("Monthly MRes2",OBJ_TEXT,0,0,0);
      ObjectSetText("Monthly MRes2","        mmR 2",8,"Arial",White);
      ObjectCreate("Monthly MSup3",OBJ_TEXT,0,0,0);
      ObjectSetText("Monthly MSup3","        mmS 3",8,"Arial",White);
      ObjectCreate("Monthly MRes3",OBJ_TEXT,0,0,0);
      ObjectSetText("Monthly MRes3","        mmR 3",8,"Arial",White);
     }
   for(i=limit-1; i>=0; i--)
      {
       // 1sts Days of Month
	    if(TimeDay(Time[i])<=3 && TimeDay(Time[i+1])>=26)
	      {
		    last_month_close=Close[i+1];
		    this_month_open=Open[i];
		    P=(last_month_high+last_month_low+last_month_close+this_month_open)/4;
          R1=(((2*P)-last_month_low)-P)/2 +P;
          S1=(((2*P)-last_month_high)-P)/2 +P;
          R2=((P+(last_month_high-last_month_low))-((2*P)-last_month_low))/2 + (2*P)-last_month_low;
          S2=(((2*P)-last_month_high)-(P-(last_month_high-last_month_low)))/2 + P-(last_month_high-last_month_low);
          R3=((2*P)+(last_month_high-(2*last_month_low)) - (P+(last_month_high-last_month_low)))/2 + P+(last_month_high-last_month_low);
          S3=((P-(last_month_high-last_month_low))-((2*P)-((2*last_month_high)-last_month_low)))/2 + (2*P)-((2*last_month_high)-last_month_low);
        	 ObjectMove("Monthly Pivot",0,Time[i],P);
          ObjectMove("Monthly MSup1",0,Time[i],S1);
          ObjectMove("Monthly MRes1",0,Time[i],R1);
          ObjectMove("Monthly MSup2",0,Time[i],S2);
          ObjectMove("Monthly MRes2",0,Time[i],R2);
          ObjectMove("Monthly MSup3",0,Time[i],S3);
          ObjectMove("Monthly MRes3",0,Time[i],R3);
          last_month_low=Low[i];
          last_month_high=High[i];
         }
       last_month_low=MathMin(last_month_low,Low[i]);
       last_month_high=MathMax(last_month_high,High[i]);
       PBuffer[i]=P;
       S1Buffer[i]=S1;
       R1Buffer[i]=R1;
       S2Buffer[i]=S2;
       R2Buffer[i]=R2;
       S3Buffer[i]=S3;
       R3Buffer[i]=R3;
      }
//----
   return(0);
  }
//+------------------------------------------------------------------+
Comments