MonthlyPivot_001
Download script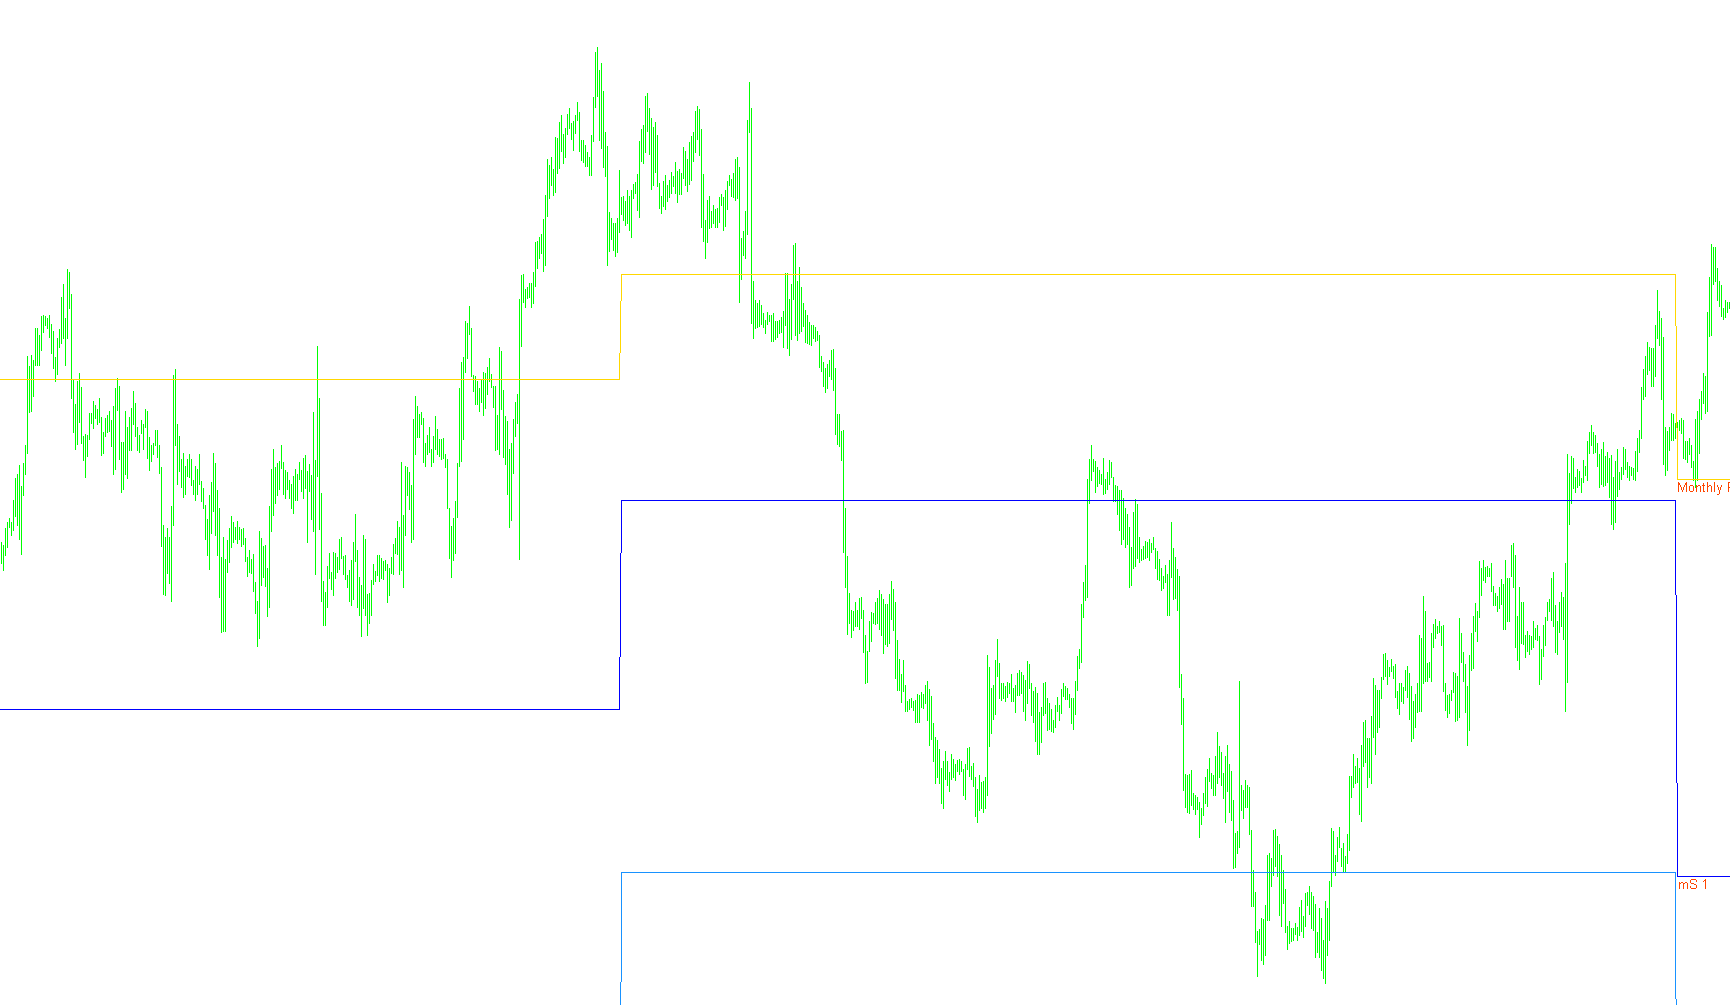
This script is designed to provide traders with a clear visual map of key price levels on their trading charts. It automatically calculates and displays "Monthly Pivot Points," which are essential technical analysis tools used to identify potential areas of support (where prices might stop falling) and resistance (where prices might stop rising) over the course of a month.
How the Logic Works
The script functions by analyzing historical price data from the previous month to project key levels for the current month. Here is the step-by-step logic it follows:
1. Data Collection To determine where the market might move, the tool looks at three specific pieces of information from the preceding month:
- The highest price reached (High).
- The lowest price reached (Low).
- The final closing price (Close). It also considers the opening price of the current month to factor in immediate momentum.
2. Pivot Point Calculation The script calculates a central "Pivot Point" (P), which acts as the equilibrium level for the market. This is derived by averaging the previous month's high, low, and closing prices along with the current month's opening price.
3. Support and Resistance Layers Once the central Pivot Point is established, the script uses mathematical formulas to project three distinct levels of support and resistance:
- Primary Levels (S1/R1): These represent the first major hurdles or safety nets near the pivot point.
- Secondary Levels (S2/R2): These provide deeper zones of potential price turning points, calculated based on the total range (the distance between high and low) of the previous month.
- Tertiary Levels (S3/R3): These represent extreme boundaries. They are used to identify "overextended" markets where prices might face significant exhaustion.
4. Dynamic Charting The script is programmed to be intelligent about its placement on your chart:
- Time Filtering: It specifically monitors the transition between months. When it detects the start of a new month, it updates all the calculations automatically.
- Visual Mapping: It draws these levels as lines on your chart so you can see exactly where the "floors" and "ceilings" are in real-time.
- Compatibility: To ensure the data remains accurate and meaningful, the script is designed to run only on daily charts or lower (such as H4 or H1), preventing the data from becoming cluttered or distorted on monthly timeframes.
Summary for the Trader
Instead of having to manually calculate complex formulas every month, this tool automates that process. It gives you a constant visual guide of where institutional "memory" suggests price might react, helping you identify potential entry and exit zones more effectively.
//+------------------------------------------------------------------+
//|                                                    Monthly Pivot |
//|                                    Copyright © 2006, Profitrader |
//|                                    Coded/Verified by Profitrader |
//+------------------------------------------------------------------+
#property copyright "Copyright © 2006, Profitrader."
#property link      "profitrader@inbox.ru"

#property indicator_chart_window
#property indicator_buffers 7
#property indicator_color1 Orchid
#property indicator_color2 SlateBlue
#property indicator_color3 IndianRed
#property indicator_color4 SlateBlue
#property indicator_color5 IndianRed
#property indicator_color6 DarkOliveGreen
#property indicator_color7 DarkOliveGreen
//---- buffers
double PBuffer[];
double S1Buffer[];
double R1Buffer[];
double S2Buffer[];
double R2Buffer[];
double S3Buffer[];
double R3Buffer[];

double P,S1,R1,S2,R2,S3,R3,last_month_high,last_month_low,last_month_close,this_month_open;
//+------------------------------------------------------------------+
//| Custom indicator initialization function                         |
//+------------------------------------------------------------------+
int init()
  {
   SetIndexBuffer(0,PBuffer);
   SetIndexBuffer(1,S1Buffer);
   SetIndexBuffer(2,R1Buffer);
   SetIndexBuffer(3,S2Buffer);
   SetIndexBuffer(4,R2Buffer);
   SetIndexBuffer(5,S3Buffer);
   SetIndexBuffer(6,R3Buffer);
   SetIndexStyle(0,DRAW_LINE,0,1);
   SetIndexStyle(1,DRAW_LINE,0,1);
   SetIndexStyle(2,DRAW_LINE,0,1);
   SetIndexStyle(3,DRAW_LINE,0,1);
   SetIndexStyle(4,DRAW_LINE,0,1);
   SetIndexStyle(5,DRAW_LINE,0,1);
   SetIndexStyle(6,DRAW_LINE,0,1);
   SetIndexLabel(0,"Monthly Pivot Point");
   SetIndexLabel(1,"Monthly Support 1");
   SetIndexLabel(2,"Monthly Resistant 1");
   SetIndexLabel(3,"Monthly Support 2");
   SetIndexLabel(4,"Monthly Resistant 2");
   SetIndexLabel(5,"Monthly Support 3");
   SetIndexLabel(6,"Monthly Resistant 3");
   return(0);
  }
//+------------------------------------------------------------------+
//| Custor indicator deinitialization function                       |
//+------------------------------------------------------------------+
int deinit()
  {
   ObjectDelete("Monthly Pivot");
   ObjectDelete("Monthly Sup1");
   ObjectDelete("Monthly Res1");
   ObjectDelete("Monthly Sup2");
   ObjectDelete("Monthly Res2");
   ObjectDelete("Monthly Sup3");
   ObjectDelete("Monthly Res3");
   return(0);
  }
//+------------------------------------------------------------------+
//| Custom indicator iteration function                              |
//+------------------------------------------------------------------+
int start()
  {
   int i,counted_bars=IndicatorCounted();
//---- check for possible errors
   if(counted_bars<0) return(-1);
//---- last counted bar will be recounted
   if(counted_bars>0) counted_bars--;
   int limit=Bars-counted_bars;

   if(Period()>PERIOD_D1) return(-1);
   if(counted_bars==0)
     {
      ObjectCreate("Monthly Pivot",OBJ_TEXT,0,0,0);
      ObjectSetText("Monthly Pivot","                            Monthly Pivot Point",10,"Arial",OrangeRed);
      ObjectCreate("Monthly Sup1",OBJ_TEXT,0,0,0);
      ObjectSetText("Monthly Sup1","        mS 1",10,"Arial",OrangeRed);
      ObjectCreate("Monthly Res1",OBJ_TEXT,0,0,0);
      ObjectSetText("Monthly Res1","        mR 1",10,"Arial",OrangeRed);
      ObjectCreate("Monthly Sup2",OBJ_TEXT,0,0,0);
      ObjectSetText("Monthly Sup2","        mS 2",10,"Arial",OrangeRed);
      ObjectCreate("Monthly Res2",OBJ_TEXT,0,0,0);
      ObjectSetText("Monthly Res2","        mR 2",10,"Arial",OrangeRed);
      ObjectCreate("Monthly Sup3",OBJ_TEXT,0,0,0);
      ObjectSetText("Monthly Sup3","        mS 3",10,"Arial",OrangeRed);
      ObjectCreate("Monthly Res3",OBJ_TEXT,0,0,0);
      ObjectSetText("Monthly Res3","        mR 3",10,"Arial",OrangeRed);
     }
   for(i=limit-1; i>=0; i--)
      {
       // 1sts Days of Month
	    if(TimeDay(Time[i])<=3 && TimeDay(Time[i+1])>=26)
	      {
		    last_month_close=Close[i+1];
		    this_month_open=Open[i];
		    P=(last_month_high+last_month_low+last_month_close+this_month_open)/4;
          R1=(2*P)-last_month_low;
          S1=(2*P)-last_month_high;
          R2=P+(last_month_high-last_month_low);
          S2=P-(last_month_high-last_month_low);
          R3=(2*P)+(last_month_high-(2*last_month_low));
          S3=(2*P)-((2*last_month_high)-last_month_low);
        	 ObjectMove("Monthly Pivot",0,Time[i],P);
          ObjectMove("Monthly Sup1",0,Time[i],S1);
          ObjectMove("Monthly Res1",0,Time[i],R1);
          ObjectMove("Monthly Sup2",0,Time[i],S2);
          ObjectMove("Monthly Res2",0,Time[i],R2);
          ObjectMove("Monthly Sup3",0,Time[i],S3);
          ObjectMove("Monthly Res3",0,Time[i],R3);
          last_month_low=Low[i];
          last_month_high=High[i];
         }
       last_month_low=MathMin(last_month_low,Low[i]);
       last_month_high=MathMax(last_month_high,High[i]);
       PBuffer[i]=P;
       S1Buffer[i]=S1;
       R1Buffer[i]=R1;
       S2Buffer[i]=S2;
       R2Buffer[i]=R2;
       S3Buffer[i]=S3;
       R3Buffer[i]=R3;
      }
//----
   return(0);
  }
//+------------------------------------------------------------------+
Comments