MACD-OsMA(AM).3
Download script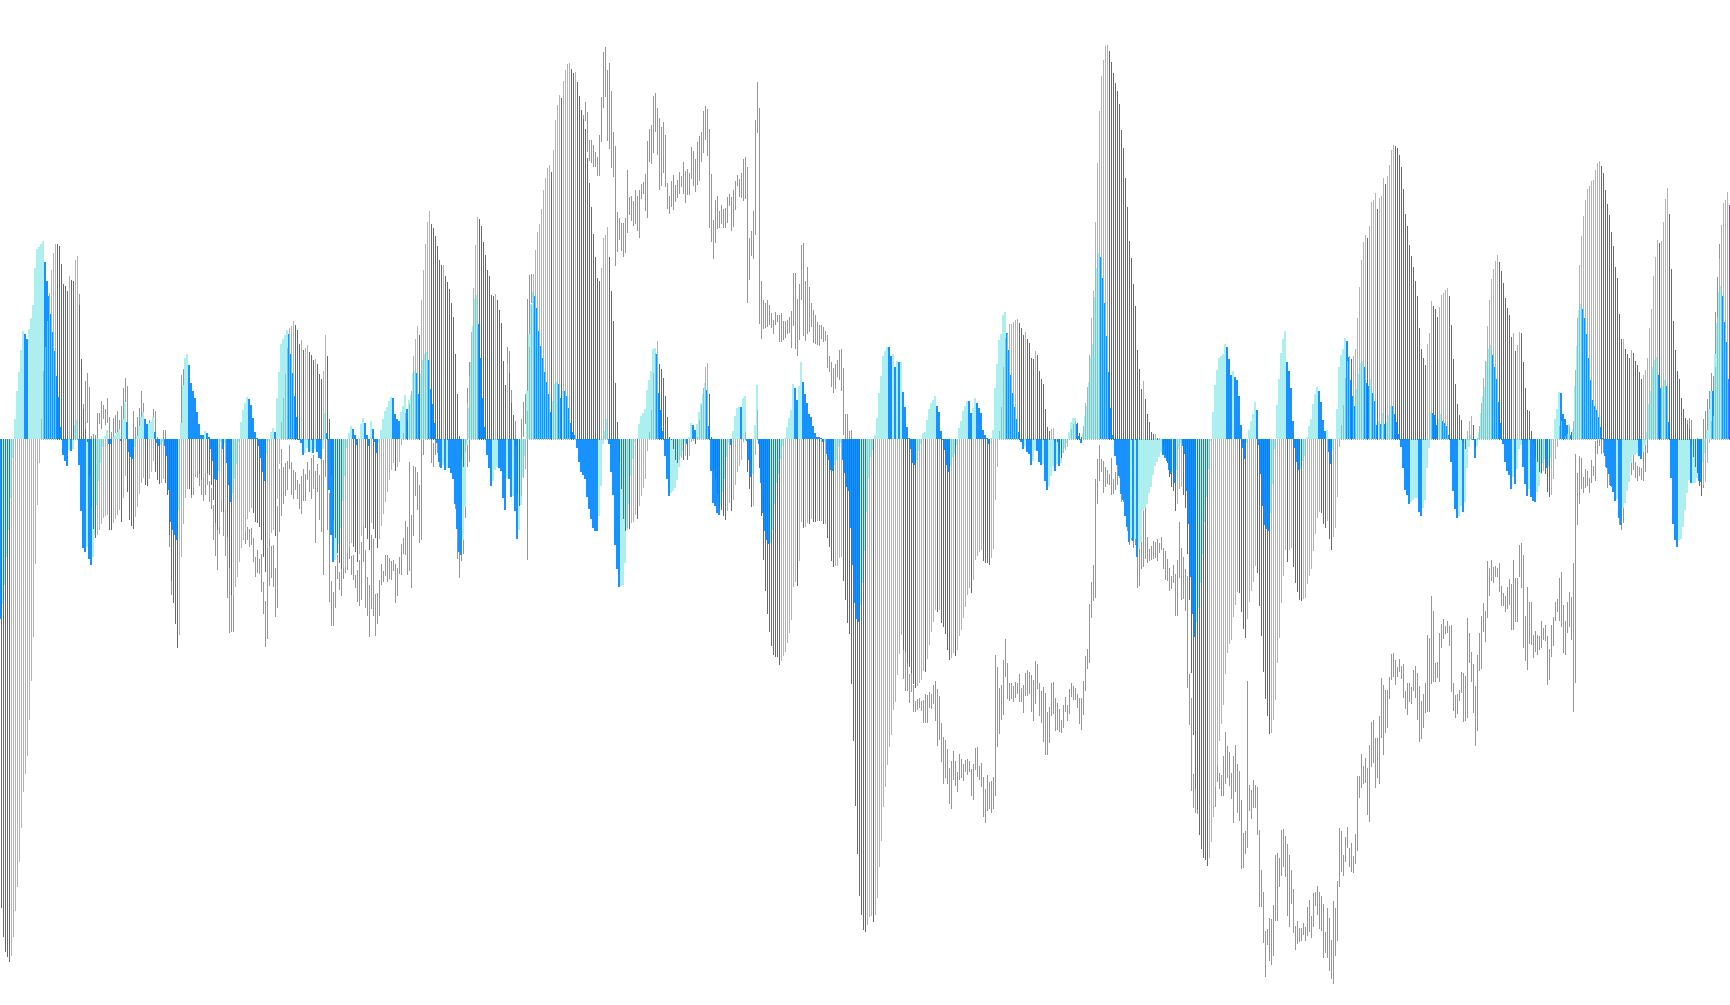
This specialized technical indicator is designed to provide traders with a multi-layered visual representation of market momentum and trend dynamics. By blending traditional moving average calculations with custom logic, it helps identify the direction, strength, and potential exhaustion of price movements in real-time.
Core Logic Overview
The tool functions by analyzing two primary types of data: the relationship between fast and slow moving averages (the MACD principle) and the specific directional behavior of those values over time.
1. The Momentum Foundation At its base level, the script calculates a standard momentum value by comparing a "Fast" moving average against a "Slow" moving average. This difference tells the user how quickly the price is moving compared to its recent history. It then applies a secondary "Signal" smoothing process to this result, which helps filter out minor market noise to reveal the broader trend.
2. Dynamic Trend Detection The logic goes beyond simple values by monitoring the "flow" of the data. The script constantly checks if the momentum is currently increasing or decreasing from one candle to the next.
- When the momentum is rising, it activates specific visual markers.
- When the momentum begins to drop, the script identifies this shift instantly.
3. Comparative Analysis (OsMA Logic) The indicator creates a sophisticated comparison between two different data sets:
- Direct Momentum: It tracks the raw difference between the fast and slow averages.
- Smoothed Momentum: It tracks the difference between the moving average and its signal line.
By comparing these two streams side-by-side, the script allows you to see if the market is accelerating or decelerating. For example, if one set of data shows growth while the other begins to shrink, it can signal that the current trend is losing steam.
Visual Representation
Instead of just showing lines on a chart, this script uses a histogram format divided into positive and negative zones. It creates a distinct "visual weight":
- Directional Histograms: The tool highlights active growth and decline in different colors (Teal and Red).
- Trend Shifts: By visualizing the "up" and "down" states of both the raw momentum and the smoothed signal, the indicator provides a clear "dual-track" view. This makes it easier for a user to see at a glance whether the market is in a state of healthy expansion or if a reversal is beginning to take shape.
In summary, this script acts as a sophisticated dashboard that translates complex moving average math into a clear visual story of market energy, helping users identify when trends are strong, when they are weakening, and where the momentum might be shifting.
//+------------------------------------------------------------------+
//|                                                MACD-OsMA(AM).mq4 |
//|                                               Andrey Matvievskiy |
//|                                                                  |
//+------------------------------------------------------------------+
#property copyright "Andrey Matvievskiy"
#property link      ""

//---- indicator settings
#property  indicator_separate_window
#property  indicator_buffers 7
#property  indicator_color1  Black
#property  indicator_color2  Black
#property  indicator_color3  Teal
#property  indicator_color4  Red
#property  indicator_color5  Teal
#property  indicator_color6  Red
#property  indicator_color7  Black

extern int FastPeriod   = 12;
extern int SlowPeriod   = 26;
extern int SignalPeriod = 9;

extern int FastMethod   = 1;
extern int SlowMethod   = 1;
extern int SignalMethod = 0;

extern int FastShift   = 0;
extern int SlowShift   = 0;
extern int SignalShift = 0;

extern int FastPrice = 0;
extern int SlowPrice = 0;

extern int TF = 0;

//---- indicator buffers
double     ExtBuffer0[];
double     ExtBuffer1[];
double     ExtBuffer2[];
double     ExtBuffer3[];
double     ExtBuffer4[];
double     ExtBuffer5[];
double     ExtBuffer6[];
//+------------------------------------------------------------------+
//| Custom indicator initialization function                         |
//+------------------------------------------------------------------+
int init()
  {
//---- 2 additional buffers are used for counting.
   IndicatorBuffers(7);
//---- drawing settings

   SetIndexStyle(0,DRAW_NONE);
   SetIndexStyle(1,DRAW_NONE);
   SetIndexStyle(2,DRAW_HISTOGRAM,0,2);
   SetIndexStyle(3,DRAW_HISTOGRAM,0,2);
   SetIndexStyle(4,DRAW_HISTOGRAM,0,1);
   SetIndexStyle(5,DRAW_HISTOGRAM,0,1);
   SetIndexStyle(6,DRAW_NONE);
   IndicatorDigits(Digits+2);

//---- 4 indicator buffers mapping
   SetIndexBuffer(0,ExtBuffer0);
   SetIndexBuffer(1,ExtBuffer1);
   SetIndexBuffer(2,ExtBuffer2);
   SetIndexBuffer(3,ExtBuffer3);
   SetIndexBuffer(4,ExtBuffer4);
   SetIndexBuffer(5,ExtBuffer5);
   SetIndexBuffer(6,ExtBuffer6);

//---- name for DataWindow and indicator subwindow label
   IndicatorShortName("MACD-OsMA(AM) (TF "+TF+") ("+FastPeriod+","+SlowPeriod+","+SignalPeriod+")");

   SetIndexLabel(0,NULL);
   SetIndexLabel(1,NULL);

   SetIndexLabel(2,"OsMA+");
   SetIndexLabel(3,"OsMA-");
   SetIndexLabel(4,"MACD+");
   SetIndexLabel(5,"MACD-");

   SetIndexLabel(6,NULL);
   SetIndexLabel(7,NULL);
//---- initialization done
   return(0);
  }
//+------------------------------------------------------------------+
//| Accelerator/Decelerator Oscillator                               |
//+------------------------------------------------------------------+
int start()
  {
   int    limit;
   int    counted_bars=IndicatorCounted();
   double prev1,current1,prev2,current2;
   if(counted_bars>0) counted_bars--;
   limit=Bars-counted_bars;
      for(int i=0; i<limit; i++)
      ExtBuffer0[i]=iMA(NULL,TF,FastPeriod,FastShift,FastMethod,FastPrice,i)-iMA(NULL,TF,SlowPeriod,SlowShift,SlowMethod,SlowPrice,i);
      for(i=0; i<limit; i++)
      ExtBuffer1[i]=iMAOnArray(ExtBuffer0,Bars,SignalPeriod,SignalShift,SignalMethod,i);
      bool up1=true;
      bool up2=true;
      for(i=limit-1; i>=0; i--)
     {

      current1=ExtBuffer0[i];
      prev1=ExtBuffer0[i+1];
      if(current1>prev1) up1=true;
      if(current1<prev1) up1=false;
      if(!up1)
        {
         ExtBuffer5[i]=current1;
         ExtBuffer4[i]=0.0;
        }
      else
        {
         ExtBuffer4[i]=current1;
         ExtBuffer5[i]=0.0;
        }

      current2=ExtBuffer0[i]-ExtBuffer1[i];
      prev2=ExtBuffer0[i+1]-ExtBuffer1[i+1];
      if(current2>prev2) up2=true;
      if(current2<prev2) up2=false;
      if(!up2)
        {
         ExtBuffer3[i]=current2;
         ExtBuffer2[i]=0.0;
        }
      else
        {
         ExtBuffer2[i]=current2;
         ExtBuffer3[i]=0.0;
        }
         ExtBuffer6[i]=current2;
     }

   //---- done
   return(0);
  }
//+------------------------------------------------------------------+
Comments