MACDdtLSMA_BC
Download script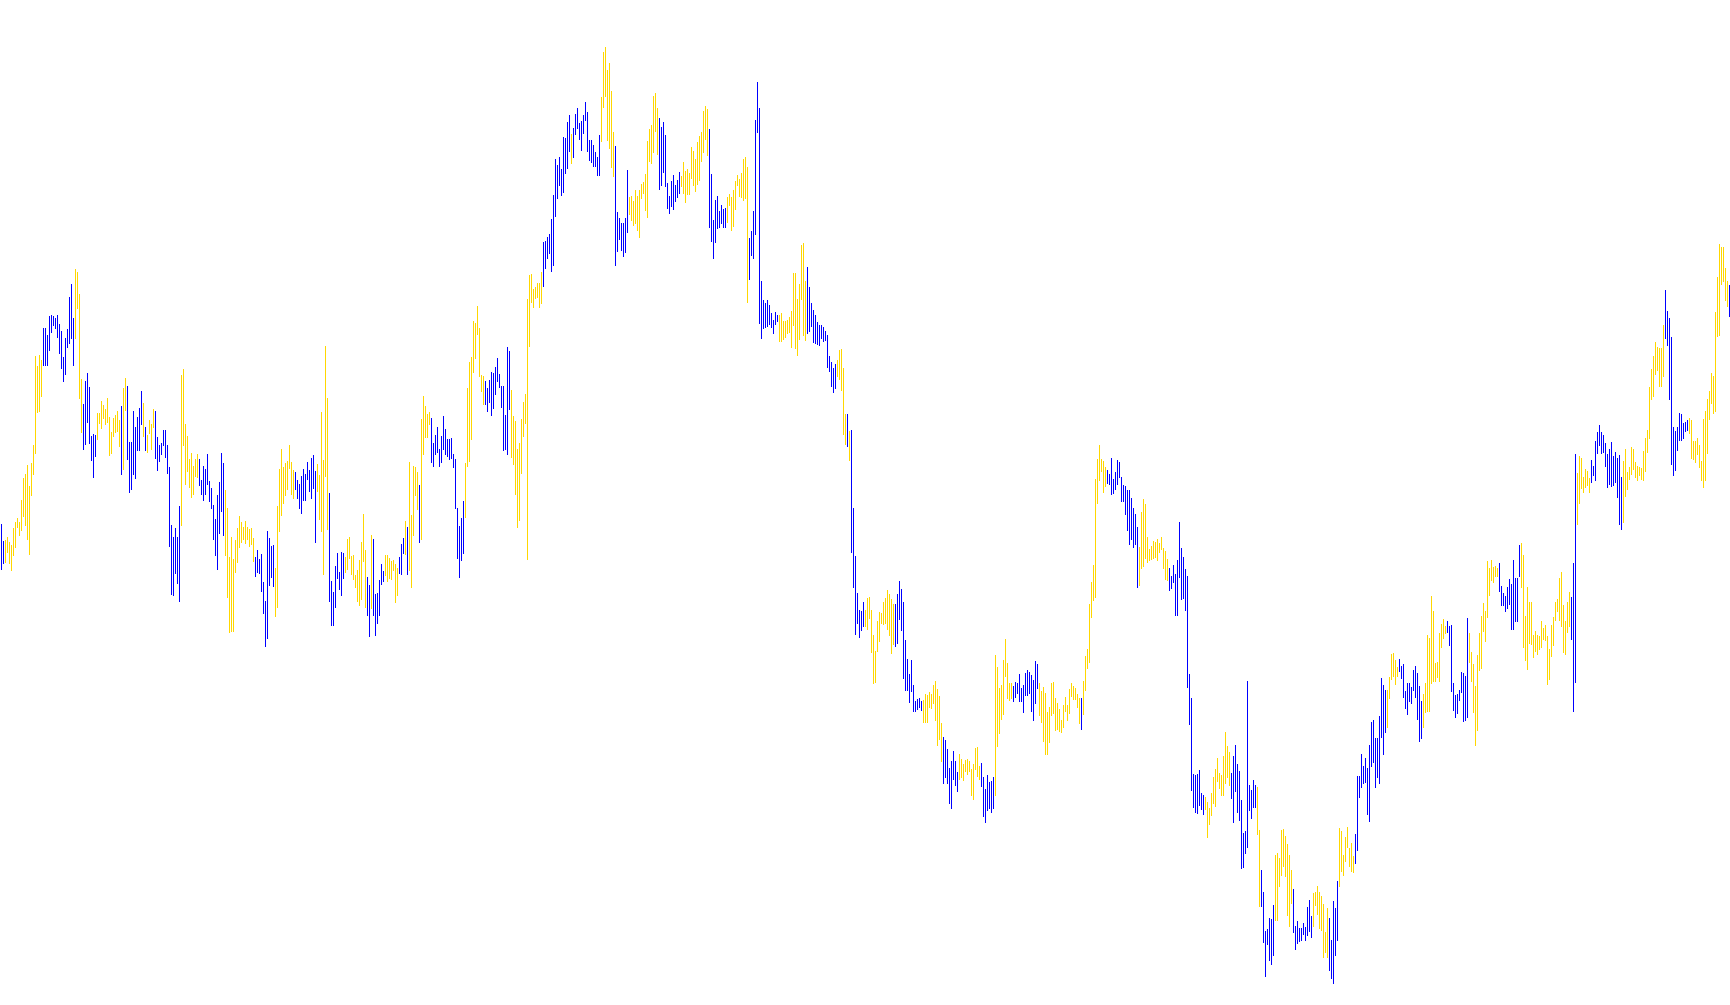
This tool is designed to analyze market trends by processing historical price data into visual signals. Rather than using standard moving averages, it utilizes a more sophisticated mathematical approach called Least Squares Moving Average (LSMA) to identify the direction of price momentum.
Core Logic and Functionality
The script operates by performing three primary calculations to provide a comprehensive view of market behavior:
1. Trend Identification via LSMA The core of this indicator is the use of "Least Squares" logic. Unlike traditional averages that simply look at the mean of past prices, this method attempts to find the "line of best fit" for a specific number of price bars. It calculates two different versions of this line: a "Fast" version (reacting quickly to recent changes) and a "Slow" version (tracking the broader, long-term trend).
2. The MACD Component The tool calculates the difference between these two LSMA lines.
- When the Fast line is significantly higher than the Slow line, it indicates upward momentum.
- When the Fast line falls below the Slow line, it indicates downward momentum. The gap between these two lines is used to plot a continuous "Signal Line" that smooths out price fluctuations to help filter out market noise.
3. Dynamic Visual Feedback (Colorizing) To make the data easy to read at a glance, the script translates the mathematical relationship between the MACD line and the Signal line into visual cues on your chart:
- Positive Momentum: If the calculated difference (the histogram value) is above zero, the script highlights the price action in one specific color (Dodger Blue).
- Negative Momentum: If the difference falls below zero, it switches the highlight to another color (Magenta).
Summary for the User
Essentially, this script acts as a momentum filter. It looks at the underlying "best-fit" trend of the market and identifies when short-term price movement is pulling away from the long-term average. By automatically changing colors based on whether that momentum is positive or negative, it allows you to see immediate shifts in market sentiment without having to manually interpret complex overlapping lines.
//+------------------------------------------------------------------+
//|                                                         MACD.mq4 |
//|                                Copyright © 2005, David W. Thomas |
//|                                           mailto:davidwt@usa.net |
//+------------------------------------------------------------------+
// This is the correct computation and display of MACD.
#property copyright "Copyright © 2005, David W. Thomas"
#property link      "mailto:davidwt@usa.net, bartlomiej.gorski@gmail.com, www.fxservice.eu"
//MODIFIED BY KALENZO - BAR COLORIZING
#property indicator_chart_window
#property indicator_buffers 2
#property indicator_color1 DodgerBlue
#property indicator_color2 Magenta
#property indicator_width1 3
#property indicator_width2 3

//---- input parameters
extern int       FastMAPeriod=12;
extern int       SlowMAPeriod=26;
extern int       SignalMAPeriod=9;

//---- buffers
double MACDLineBuffer[];
double SignalLineBuffer[];
double u[],d[];

//---- variables
double alpha = 0;
double alpha_1 = 0;

//+------------------------------------------------------------------+
//| Custom indicator initialization function                         |
//+------------------------------------------------------------------+
int init()
{
   IndicatorDigits(MarketInfo(Symbol(),MODE_DIGITS)+1);
   //---- indicators
   IndicatorBuffers(4);
   SetIndexBuffer(0,u);
   SetIndexBuffer(1,d);
   SetIndexStyle(0,DRAW_HISTOGRAM,STYLE_SOLID);
   SetIndexStyle(1,DRAW_HISTOGRAM,STYLE_SOLID);

   SetIndexBuffer(2,MACDLineBuffer);
   SetIndexBuffer(3,SignalLineBuffer);
   IndicatorShortName("MACD_LSMAdt("+FastMAPeriod+","+SlowMAPeriod+","+SignalMAPeriod+")");
   //----
	alpha = 2.0 / (SignalMAPeriod + 1.0);
	alpha_1 = 1.0 - alpha;
   //----
   return(0);
}
//+------------------------------------------------------------------+
//| Custor indicator deinitialization function                       |
//+------------------------------------------------------------------+
int deinit()
{
   //----

   //----
   return(0);
}

//+------------------------------------------------------------------------+
//| LSMA - Least Squares Moving Average function calculation               |
//| LSMA_In_Color Indicator plots the end of the linear regression line    |
//+------------------------------------------------------------------------+

double LSMA(int Rperiod, int shift)
{
   int i;
   double sum;
   int length;
   double lengthvar;
   double tmp;
   double wt;

   length = Rperiod;

   sum = 0;
   for(i = length; i >= 1  ; i--)
   {
     lengthvar = length + 1;
     lengthvar /= 3;
     tmp = 0;
     tmp = ( i - lengthvar)*Close[length-i+shift];
     sum+=tmp;
    }
    wt = sum*6/(length*(length+1));

    return(wt);
}
//+------------------------------------------------------------------+
//| Custom indicator iteration function                              |
//+------------------------------------------------------------------+
int start()
{
   int limit;
   int counted_bars = IndicatorCounted();
   //---- check for possible errors
   if (counted_bars<0) return(-1);
   //---- last counted bar will be recounted
   if (counted_bars>0) counted_bars--;
   limit = Bars - counted_bars;

   for(int i=limit; i>=0; i--)
   {
      MACDLineBuffer[i] = LSMA(FastMAPeriod,i) - LSMA(SlowMAPeriod,i);
      SignalLineBuffer[i] = alpha*MACDLineBuffer[i] + alpha_1*SignalLineBuffer[i+1];
      double histo = MACDLineBuffer[i] - SignalLineBuffer[i];
      if(histo>0)
      {
         d[i] = Low[i];
         u[i] = High[i];
      }
      else
      {
         d[i] = High[i];
         u[i] = Low[i];

      }
   }

   //----
   return(0);
}
//+------------------------------------------------------------------+
Comments