MACD Histogram WIS
Download script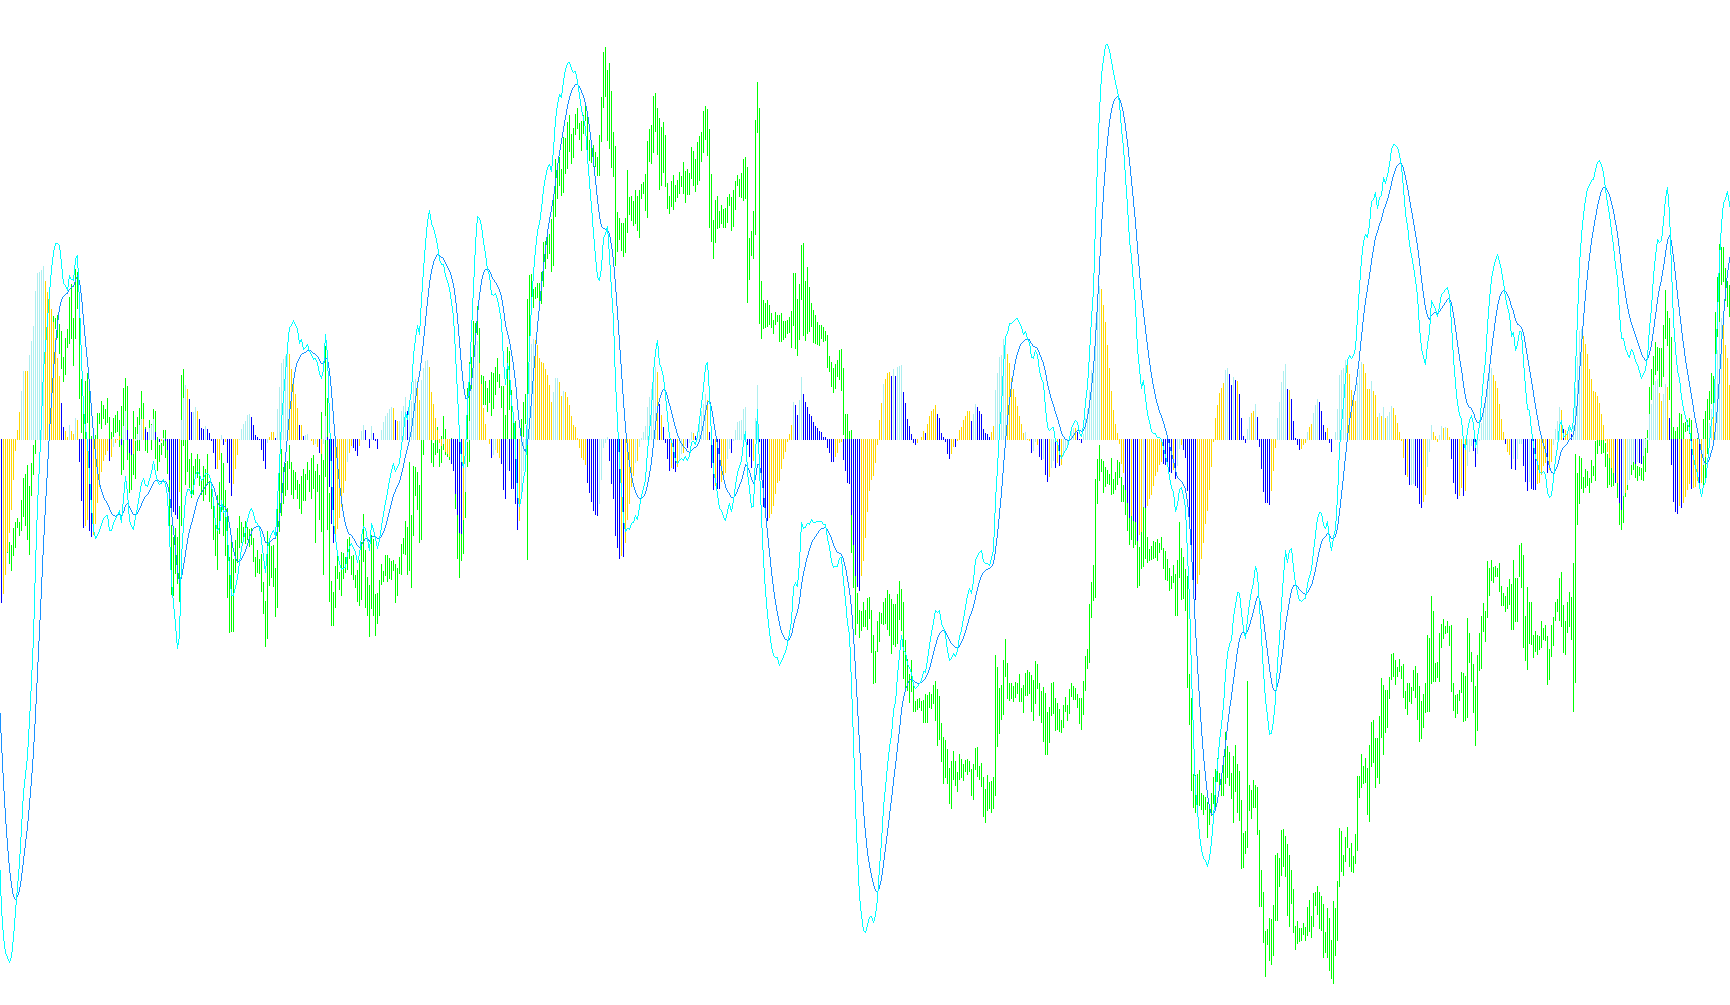
The MACD Histogram With Impulse System is a specialized technical analysis tool designed to help traders visualize market momentum and identify high-probability entry points. It enhances the standard Moving Average Convergence Divergence (MACD) indicator by adding a secondary "Filter" layer, which helps distinguish between active trend movements and indecisive price action.
Core Mechanics
At its foundation, the script calculates three primary components:
- The MACD Line: This measures the distance between two moving averages (Fast and Slow) to determine the speed of price movement.
- The Signal Line: A secondary average calculated from the MACD line itself, used to smooth out noise.
- The Histogram: The visual difference between the MACD Line and the Signal Line.
The Impulse Filter Logic
What makes this specific script unique is the "Impulse" logic. It doesn't just look at the histogram; it compares the movement of the histogram against a chosen Filter. Depending on your settings, this filter can be an additional Moving Average, the MACD line itself, or the Signal line.
The system evaluates the relationship between the Histogram and the Filter to categorize the market into three distinct visual states:
- Bullish Impulse (Buy): When the histogram is rising and the filter is also rising simultaneously. This suggests strong upward momentum where both the price trend and the underlying average are in agreement.
- Bearish Impulse (Sell): When the histogram is falling and the filter is also falling simultaneously. This indicates a synchronized downward push, signaling a stronger move against the market.
- Wait/Neutral State: If the histogram and the filter move in opposite directions (e.g., the histogram rises while the filter falls, or vice versa), the script identifies this as a "conflict." In these instances, it highlights a neutral state, suggesting that while there is movement, it lacks the unified momentum required for a high-confidence trade.
Visual Interpretation
By using different colors and styles for these states, the tool allows you to quickly scan a chart:
- Green Bars: Represent confirmed upward impulse (Buy signals).
- Red Bars: Represent confirmed downward impulse (Sell signals).
- Gray/Neutral Bars: Represent "Wait" zones where the market is showing mixed signals or lacks sufficient momentum.
Summary for Traders
Instead of making you guess whether a rising histogram is a "real" move, this script verifies that movement against a secondary mathematical baseline. It filters out "fake" movements where the price might be oscillating weakly, only highlighting the bars where there is a clear, synchronized trend in both momentum and average price.
/********************************************************************************
 *                                                       MACD Histogram WIS.mq4 *
 *                                           MACD Histogram With Impulse System *
 *                             Copyright © 2009, G.Vladimir.Ivanovich@gmail.com *
 *                                        mailto:G.Vladimir.Ivanovich@gmail.com *
 *******************************************************************************/
#property copyright "Copyright © 2009, G.Vladimir.Ivanovich@gmail.com"
#property link      "mailto:G.Vladimir.Ivanovich@gmail.com"

/*******************************************************************************/
#property  indicator_separate_window
#property  indicator_buffers 5

#property  indicator_color1 LightGray
#property  indicator_width1 2

#property  indicator_color2 Red
#property  indicator_width2 2

#property  indicator_color3 Green
#property  indicator_width3 2

#property  indicator_color4 Maroon
#property  indicator_width4 2

#property  indicator_color5 Orange
#property  indicator_width5 2

/*******************************************************************************/
extern	int FastMA			= 12;/* Ïåðèîä áûñòðîé ñêîëüçÿùåé ñðåäíåé          */
extern	int SlowMA			= 26;/* Ïåðèîä ìåäëåííîé ñêîëüçÿùåé ñðåäíåé        */
extern	int SignalMA		= 9; /* Ïåðèîä ñèãíàëüíîé ëèíèè                    */
extern	int MAPeriod		= 13;/* Ïåðèîä ñêîëüçÿùåé ñðåäíåé åñëè Line = 0    */
extern	int MAMethod		= 1; /* Ìåòîä óñðåäíåíèÿ ïî óìîë÷àíèþ MODE_EMA     */
extern	int MAAppliedPrice	= 0; /* Èñïîëüçóåìàÿ öåíà ïî óìîë÷àíèþ PRICE_CLOSE */
extern	int Line			= 0; /* Èíåðöèÿ 0-MA(MAPeriod); 1-MACD; 2-Signal   */
extern	int DigitsInc		= 2; /* Ôîðìàò òî÷íîñòè Digits + DigitsInc         */

/*******************************************************************************/
double	Histogram[];
double	HistogramWaitClose[];
double	HistogramSell[];
double	HistogramBuy[];
double	MACD[];
double	Signal[];
double	Filter[];

/*******************************************************************************/
int init()
{
	string Mode;

	SetIndexBuffer(0, HistogramWaitClose);
	SetIndexStyle(0, DRAW_HISTOGRAM);
	SetIndexEmptyValue(0, 0.0);
	SetIndexLabel(0, "Wait, Close");

	SetIndexBuffer(1, HistogramSell);
	SetIndexStyle(1, DRAW_HISTOGRAM);
	SetIndexEmptyValue(1, 0.0);
	SetIndexLabel(1, "Histogram Sell");

	SetIndexBuffer(2, HistogramBuy);
	SetIndexStyle(2, DRAW_HISTOGRAM);
	SetIndexEmptyValue(2, 0.0);
	SetIndexLabel(2, "Histogram Buy");

	SetIndexBuffer(3, Signal);
	SetIndexStyle(3, DRAW_LINE, STYLE_SOLID);
	SetIndexLabel(3, "Signal");

	SetIndexBuffer(4, MACD);
	SetIndexStyle(4, DRAW_LINE, STYLE_SOLID);
	SetIndexLabel(4, "MACD");

	if(Line <= 0) Mode = "MA(" + MAPeriod + ")";
	if(Line == 1) Mode = "MACD";
	if(Line >= 2) Mode = "Signal";

	IndicatorShortName("MACD Histogram (" + FastMA + "," + SlowMA + "," + SignalMA + ") With Filter " + Mode + "");
	IndicatorDigits(Digits + DigitsInc);

	return(0);
}

/*******************************************************************************/
int start()
{
	int limit,i;
	int counted_bars = IndicatorCounted();

	if(counted_bars > 0) counted_bars--;
	limit = iBars(NULL,0) - counted_bars;

	BufferResize(Filter);
	BufferResize(Histogram);

	for(i = 0; i <= limit; i++)
		MACD[i] = iMA(NULL, 0, FastMA, 0, MAMethod, MAAppliedPrice, i) - iMA(NULL, 0, SlowMA, 0, MAMethod, MAAppliedPrice, i);
	for(i = 0; i <= limit; i++)
		Signal[i] = iMAOnArray(MACD, iBars(NULL,0), SignalMA, 0, MAMethod, i);
	for(i = 0; i <= limit; i++)
		Histogram[i] = MACD[i] - Signal[i];
	CalcFilter(Line, limit);
	for(i = limit; i >= 0; i--)
	{
		if(Histogram[i] > Histogram[i+1] && Filter[i] > Filter[i+1])
		{
			HistogramWaitClose[i] = 0.0;
			HistogramSell[i] = 0.0;
			HistogramBuy[i] = Histogram[i];
		}
		if(Histogram[i] < Histogram[i+1] && Filter[i] < Filter[i+1])
		{
			HistogramWaitClose[i] = 0.0;
			HistogramSell[i] = Histogram[i];
			HistogramBuy[i] = 0.0;
		}
		if((Histogram[i] >= Histogram[i+1] && Filter[i] <= Filter[i+1]) || (Histogram[i] <= Histogram[i+1] && Filter[i] >= Filter[i+1]))
		{
			HistogramWaitClose[i] = Histogram[i];
			HistogramSell[i] = 0.0;
			HistogramBuy[i] = 0.0;
		}
	}

	return(0);
}


/*******************************************************************************/
void BufferResize(double &Array[])
{
	int counted_bars = ArraySize(Array) - 1;
	int limit = iBars(NULL, 0) - counted_bars;
	ArraySetAsSeries(Array, false);
	ArrayResize(Array, iBars(NULL, 0));
	for(int i = limit; i >= 0; i--)
		Array[i] = 0.0;
	ArraySetAsSeries(Array, true);
}

/*******************************************************************************/
void CalcFilter(int &a, int &max)
{
	if(a <= 0)
	{
		for(int i = 0; i <= max; i++)
			Filter[i] = iMA(NULL, 0, MAPeriod, 0, MAMethod, MAAppliedPrice, i);
		return;
	}
	if(a == 1)
	{
		ArrayCopy(Filter, MACD);
		return;
	}
	if(a >= 2)
		ArrayCopy(Filter, Signal);
}

/*******************************************************************************/
Comments