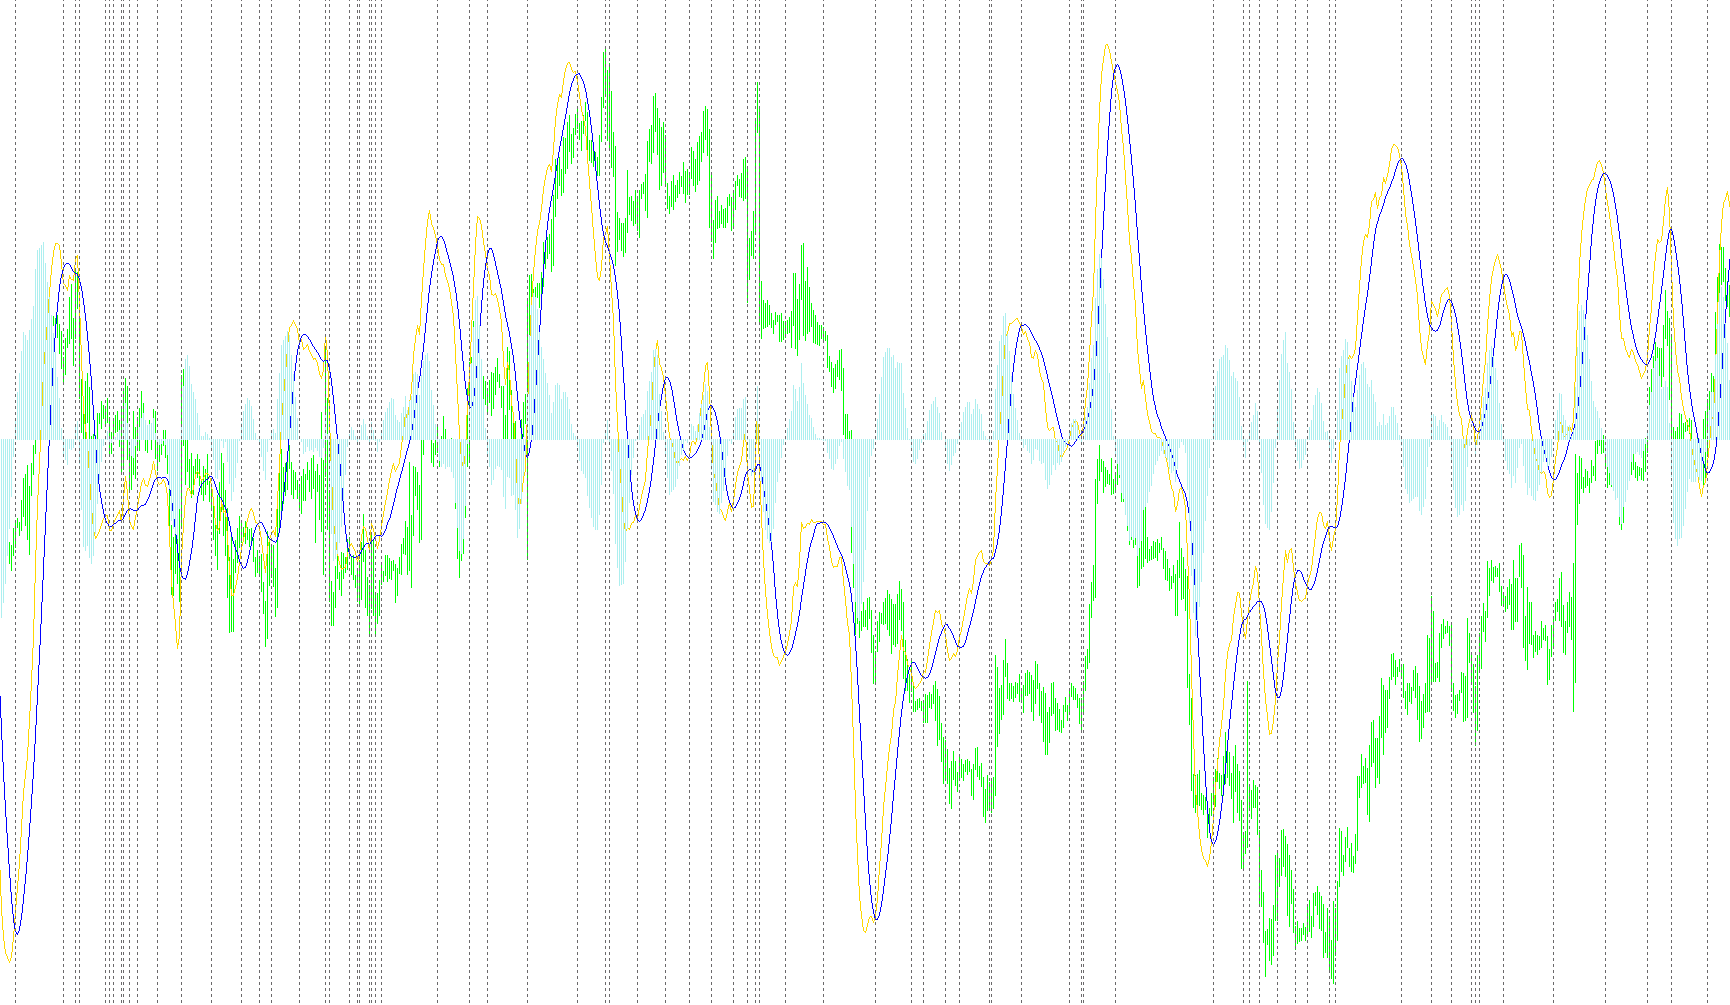
This tool is designed to help traders visualize momentum and identify specific turning points in market trends using the Moving Average Convergence Divergence (MACD) indicator. By analyzing the relationship between different price averages, the script provides a clear visual representation of whether the market is accelerating or slowing down.
How the Logic Works
The script operates by calculating three distinct layers of data simultaneously to give a comprehensive view of market behavior:
1. The MACD Line (Momentum) The tool first looks at two different types of moving averages based on the closing prices of assets. One is "fast" (reacting quickly to recent price changes) and one is "slow" (representing the broader trend). By subtracting the slow average from the fast average, it creates a single line that shows the gap between short-term and long-term price movements. When this gap widens, momentum is increasing; when it narrows, momentum is cooling off.
2. The Signal Line (Smoothing) To make the data easier to read and less "noisy," the script takes the MACD line calculated above and performs a secondary smoothing process. This creates a "Signal" line. This serves as a baseline that represents the average direction of the momentum over a set period.
3. The Histogram (Relative Strength) The script then calculates the difference between the MACD Line and the Signal Line. This result is displayed as a histogram. The height and direction of these bars tell you at a glance how far the current momentum has drifted away from its average position.
Automatic Crossing Detection
The unique feature of this specific script is its ability to automatically detect "crossings." The logic constantly monitors the relationship between the MACD line and the Signal line.
Whenever the MACD line moves from one side of the Signal line to the other, the script identifies this as a potential shift in trend. To make these points visible to the user, the tool automatically places a small, gray dotted marker on the chart at the exact moment these two lines intersect. This allows you to see historical turning points clearly without having to manually scan the entire chart for every intersection.
//+------------------------------------------------------------------+
//|                                           MACD with crossing.mq4 |
//|                      Copyright © 2004, MetaQuotes Software Corp. |
//|                                       http://www.metaquotes.net/ |
//+------------------------------------------------------------------+
#property  copyright ""
#property  link      ""
//---- indicator settings
#property  indicator_separate_window
#property  indicator_buffers 3
#property  indicator_color1  Gold
#property  indicator_color2  Red
#property  indicator_color3  Gray
#property  indicator_width1  2
//---- indicator parameters
extern int FastEMA=12;
extern int SlowEMA=26;
extern int SignalSMA=9;
//---- indicator buffers
double     MacdBuffer[];
double     SignalBuffer[];
double     HistogramBuffer[];
//---- globals
int        maxLines;
//+------------------------------------------------------------------+
//| Custom indicator initialization function                         |
//+------------------------------------------------------------------+
int init()
  {
   SetIndexStyle(0,DRAW_LINE);
   SetIndexStyle(1,DRAW_LINE);
   SetIndexStyle(2,DRAW_HISTOGRAM);
   //
   SetIndexBuffer(0,MacdBuffer);
   SetIndexBuffer(1,SignalBuffer);
   SetIndexBuffer(2,HistogramBuffer);
   //
   SetIndexLabel(0,"MACD");
   SetIndexLabel(1,"Signal");
   SetIndexLabel(2,"MACD-Signal");
   //
   SetIndexDrawBegin(1,SignalSMA);
   IndicatorDigits(Digits+1);
   IndicatorShortName("MACD("+FastEMA+","+SlowEMA+","+SignalSMA+")");
   return(0);
  }
//+------------------------------------------------------------------+
//|                                                                  |
//+------------------------------------------------------------------+
int deinit()
  {
   DeleteLines();
   return(0);
  }
//+------------------------------------------------------------------+
//| Moving Averages Convergence/Divergence                           |
//+------------------------------------------------------------------+
int start()
  {
   double crossing;
   int limit,i;
   int counted_bars=IndicatorCounted();
//----
   if(counted_bars>0) counted_bars--;
   limit=Bars-counted_bars;
//----
   for(i=0; i<limit; i++) MacdBuffer[i]=iMA(NULL,0,FastEMA,0,MODE_EMA,PRICE_CLOSE,i)-iMA(NULL,0,SlowEMA,0,MODE_EMA,PRICE_CLOSE,i);
     for(i=0; i<limit; i++)
     {
      SignalBuffer[i]=iMAOnArray(MacdBuffer,Bars,SignalSMA,0,MODE_SMA,i);
      HistogramBuffer[i]=MacdBuffer[i] - SignalBuffer[i];
     }
//----
   DeleteLines();
   for(i=WindowBarsPerChart(); i>0 ;i--)
     {
      crossing=(MacdBuffer[i]-SignalBuffer[i])*(MacdBuffer[i+1]-SignalBuffer[i+1]);
      if (crossing < 0)
        {
         maxLines+=1;
         ObjectCreate("MacdCross"+maxLines,0,0,Time[i],0);
         ObjectSet("MacdCross"+maxLines,OBJPROP_COLOR,DimGray);
         ObjectSet("MacdCross"+maxLines,OBJPROP_STYLE,STYLE_DOT);
        }
     }
   return(0);
  }
//+------------------------------------------------------------------+
//|                                                                  |
//+------------------------------------------------------------------+
void DeleteLines()
  {
   for(int i=1;i<=maxLines;i++) ObjectDelete("MacdCross"+i); maxLines=0;
  }
//+------------------------------------------------------------------+
Comments