MACDTrad
Download script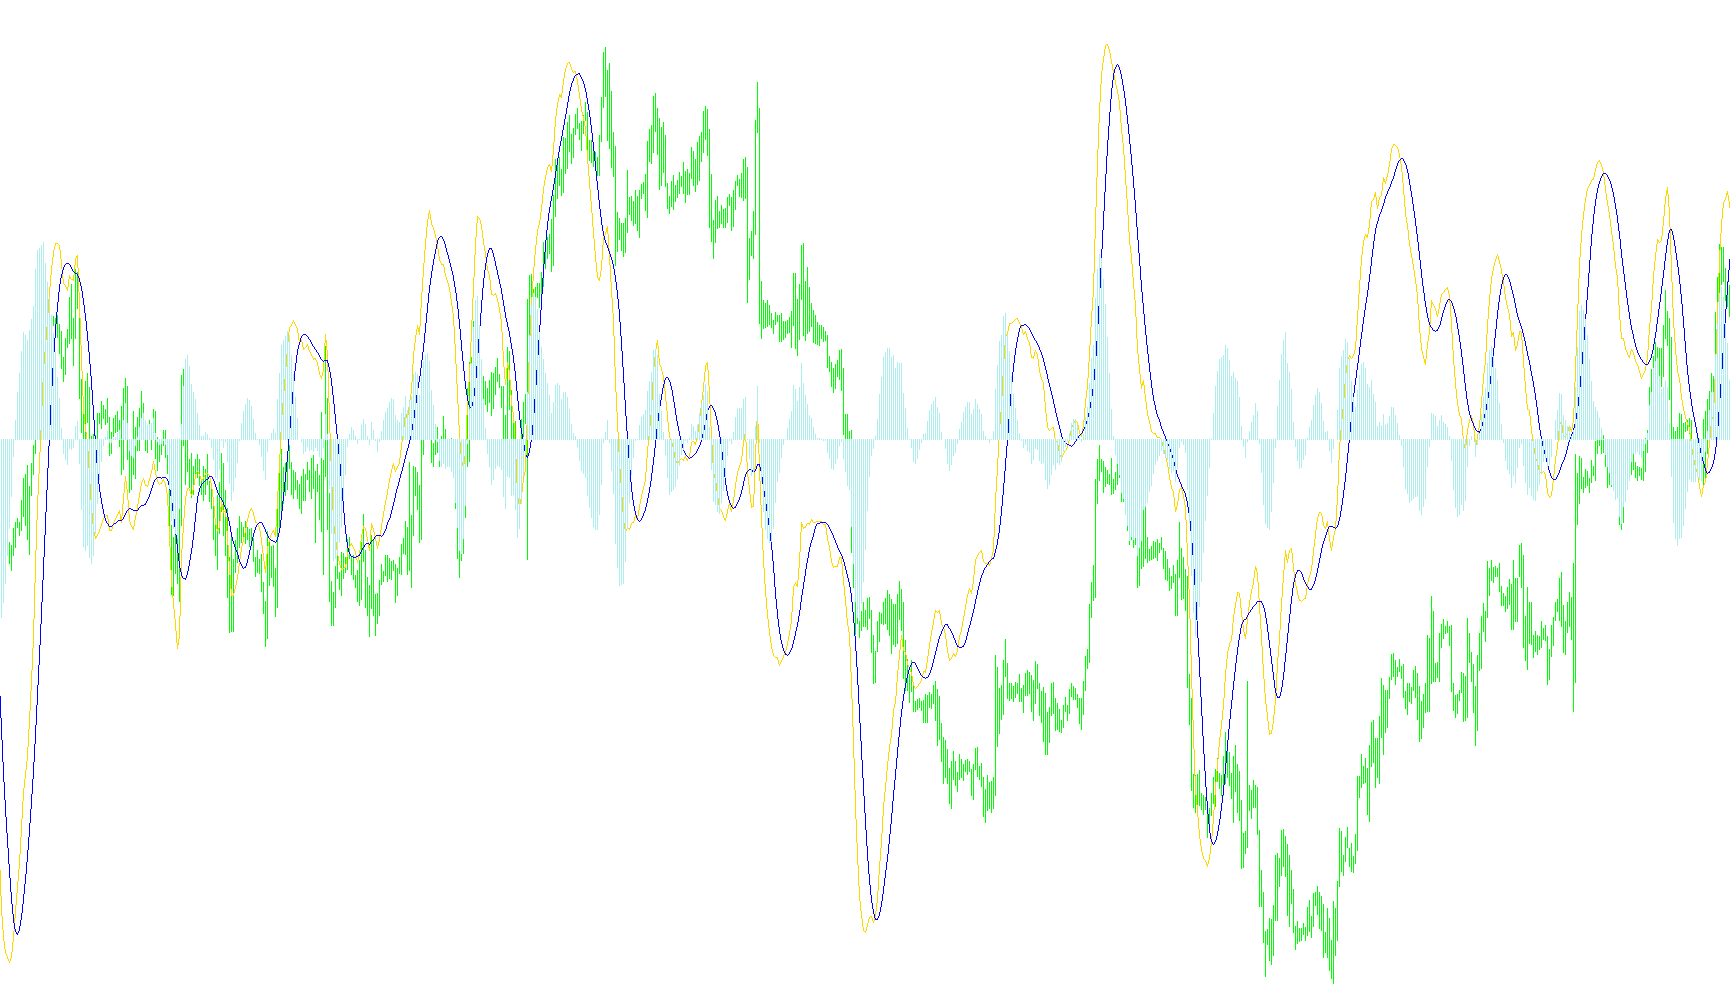
This tool is a technical analysis indicator designed to help traders visualize momentum and identify shifts in market trends. It functions by analyzing the relationship between two different moving averages of price data, providing a clearer picture of whether the market is gaining strength or losing steam.
How the Logic Works
The script processes market data through three distinct layers of calculation to generate its visual output:
1. The Momentum Core (MACD Line) The primary logic begins by calculating two different "Exponential Moving Averages" (EMAs). One is "Fast" (reacting quickly to recent price changes) and the other is "Slow" (tracking the broader trend). The script subtracts the Slow average from the Fast average.
- What this tells you: When the difference is positive and increasing, it suggests upward momentum. When it is negative and decreasing, it suggests downward pressure. This result is plotted as a continuous line on your chart.
2. The Signal Smoothing (Signal Line) To prevent reacting to every minor price flicker, the script takes the results from the first step (the Momentum Core) and runs them through another moving average—a "Simple Moving Average" (SMA).
- What this tells you: This creates a smoothed "Signal" line. Traders often look for the point where the Momentum Core crosses over this Signal line, as these intersections are frequently used to identify potential entry or exit points in a trend.
3. The Visual Summary (Histogram) Finally, the script performs a third calculation by measuring the gap between the Momentum Core and the Signal Line. This difference is displayed as a vertical histogram (bars).
- What this tells you: The height of these bars represents the intensity of the current momentum. When the bars are tall, the trend is strong; when they shrink toward the zero mark, it indicates that the trend is weakening or potentially reversing.
Summary of Visual Components
- The Main Line (Silver): Represents the raw difference between fast and slow price trends.
- The Signal Line (Red): Represents the smoothed average of that difference to help filter out "noise."
- The Histogram (Blue): Provides a quick visual pulse of the market's current strength, showing how far apart the two main trend components are at any given moment.
//---- indicator settings
#property  indicator_separate_window
#property  indicator_buffers 3
#property  indicator_color1  Silver
#property  indicator_color2  Red
#property  indicator_color3  Blue
#property  indicator_width1  2
//---- indicator parameters
extern int FastEMA=12;
extern int SlowEMA=26;
extern int SignalSMA=9;
//---- indicator buffers
double     MacdBuffer[];
double     SignalBuffer[];
double     HistoBuffer[];

//+------------------------------------------------------------------+
//| Custom indicator initialization function                         |
//+------------------------------------------------------------------+
int init()
  {
//---- drawing settings
   SetIndexStyle(0,DRAW_LINE);
   SetIndexStyle(1,DRAW_LINE);
   SetIndexStyle(2,DRAW_HISTOGRAM);
   SetIndexDrawBegin(1,SignalSMA);
   IndicatorDigits(Digits+1);
//---- indicator buffers mapping
   SetIndexBuffer(0,MacdBuffer);
   SetIndexBuffer(1,SignalBuffer);
   SetIndexBuffer(2,HistoBuffer);
//---- name for DataWindow and indicator subwindow label
   IndicatorShortName("MACD("+FastEMA+","+SlowEMA+","+SignalSMA+")    !! :)");
   SetIndexLabel(0,"MACD YO");
   SetIndexLabel(1,"Signal YO");
   SetIndexLabel(2,"H I S T O :):)");
//---- initialization done
   return(0);
  }
//+------------------------------------------------------------------+
//| Moving Averages Convergence/Divergence                           |
//+------------------------------------------------------------------+
int start()
  {
   int limit;
   int counted_bars=IndicatorCounted();
//---- last counted bar will be recounted
   if(counted_bars>0) counted_bars--;
   limit=Bars-counted_bars;
//---- macd counted in the 1-st buffer
   for(int i=0; i<limit; i++)
      MacdBuffer[i]=iMA(NULL,0,FastEMA,0,MODE_EMA,PRICE_CLOSE,i)-iMA(NULL,0,SlowEMA,0,MODE_EMA,PRICE_CLOSE,i);
//---- signal line counted in the 2-nd buffer
   for(i=0; i<limit; i++)
      SignalBuffer[i]=iMAOnArray(MacdBuffer,Bars,SignalSMA,0,MODE_SMA,i);
//---- histogram line counted in the 3-nd buffer
   for(i=0; i<limit; i++)
      HistoBuffer[i]=MacdBuffer[i]-SignalBuffer[i];
//---- done
   return(0);
  }
//+------------------------------------------------------------------+
Comments