MACD trad
Download script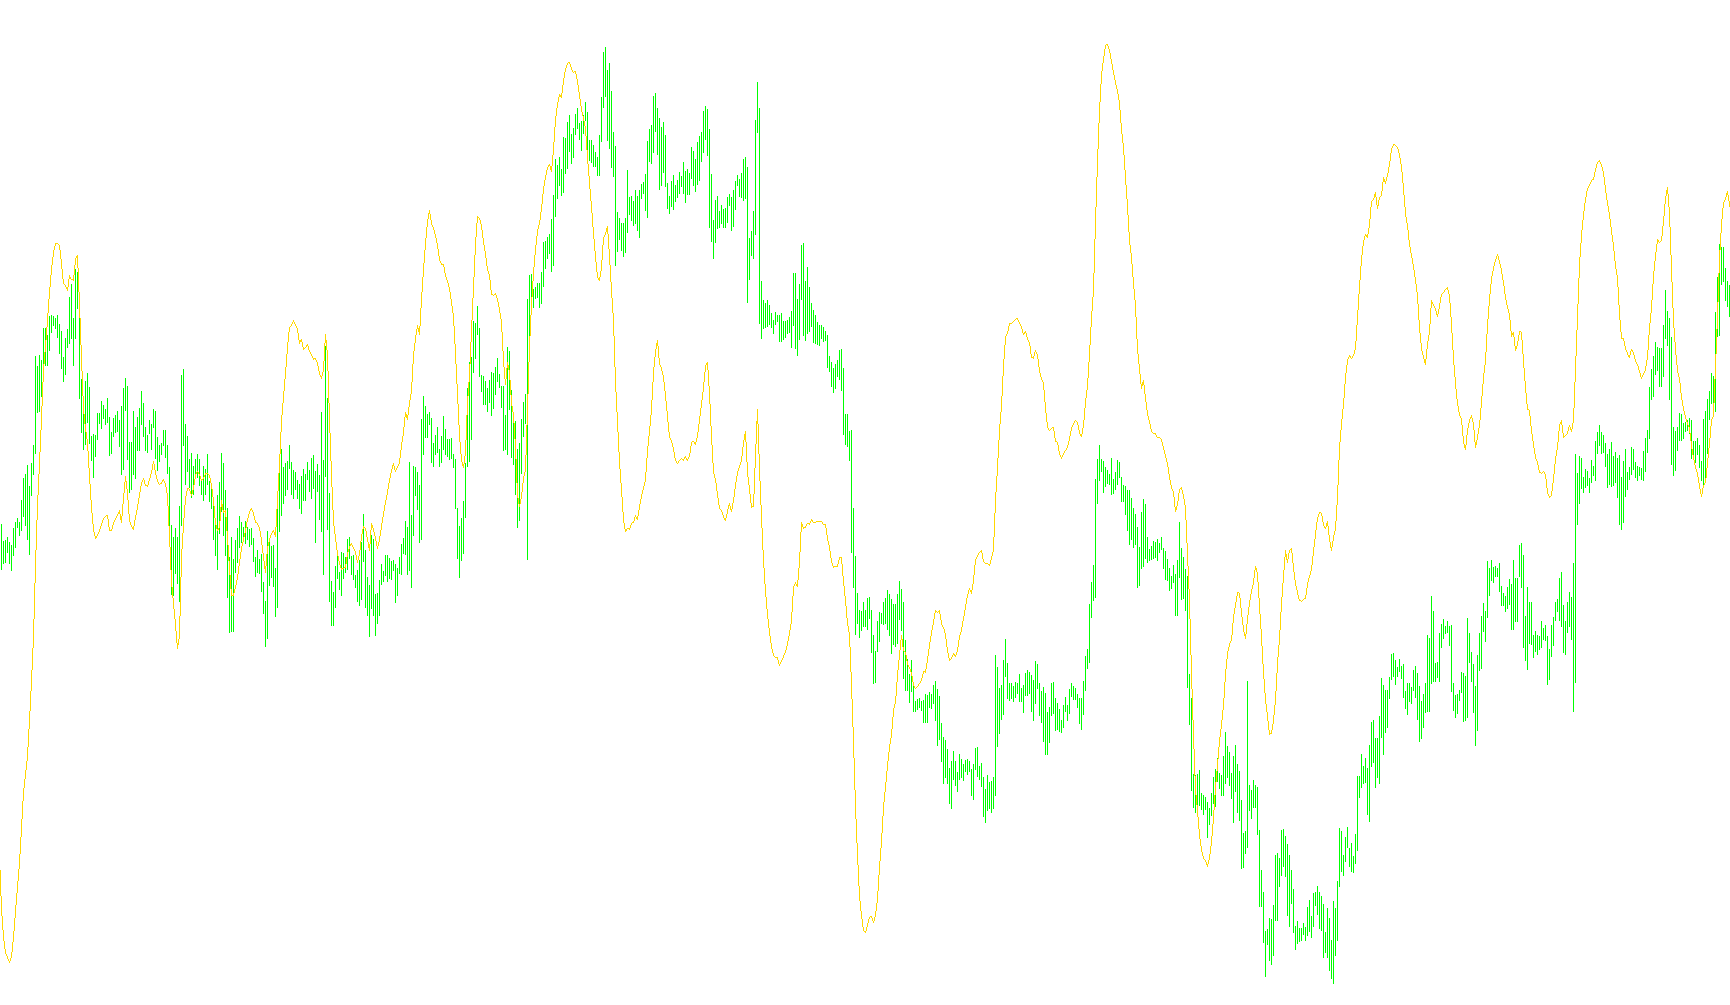
This technical tool is designed to provide traders with a visual representation of momentum and price trends by analyzing the relationship between two different moving averages. It functions as an overlay in a separate window, allowing users to observe market shifts without cluttering the main price chart.
Core Logic and Components
The script processes market data through three distinct layers of calculation:
1. Momentum Calculation (The MACD Line) The primary logic begins by comparing two different types of moving averages: a "Fast" average and a "Slow" average. By subtracting the value of the slow average from the fast one, the tool identifies the gap between immediate price action and the longer-term trend. If the fast average is above the slow average, it suggests upward momentum; if it is below, it indicates downward pressure.
2. Trend Smoothing (The Signal Line) To help filter out "noise" and minor price fluctuations, the script takes the resulting values from the first step and applies a secondary smoothing calculation (a Simple Moving Average). This creates a "Signal Line," which acts as a baseline to determine whether the current momentum is gaining strength or losing steam.
3. Visual Momentum (The Histogram) The final component of the tool is the histogram. This is calculated by taking the difference between the primary MACD line and the Signal Line and doubling that value. This creates a prominent visual bar that represents the "distance" between the current momentum and its smoothed average.
How to Interpret the Data
By observing these three elements together, users can see:
- Direction: Whether price momentum is trending up or down based on the position of the lines.
- Strength: The height of the histogram bars indicates the intensity of the current trend.
- Convergence/Divergence: When the MACD line and the Signal Line move toward or away from each other, it provides a visual cue regarding potential changes in market behavior.
//+------------------------------------------------------------------+
//|                                                    MACD trad.mq4 |
//|                                                   David Louisson |
//|                                        http://www.metaquotes.net |
//+------------------------------------------------------------------+
#property copyright "David Louisson"
#property link      "http://www.metaquotes.net"

//---- indicator settings
#property  indicator_separate_window
#property  indicator_buffers 3
#property  indicator_color1  Lime
#property  indicator_color2  PeachPuff
#property  indicator_style2  STYLE_DOT
#property  indicator_color3  Silver
#property  indicator_width3  3
//---- indicator parameters
extern int FastEMA=12;
extern int SlowEMA=26;
extern int SignalSMA=9;
//---- indicator buffers
double     ind_buffer1[];
double     ind_buffer2[];
double     ind_buffer3[];

//+------------------------------------------------------------------+
//| Custom indicator initialization function                         |
//+------------------------------------------------------------------+
int init()
  {
//---- drawing settings
   SetIndexStyle(2,DRAW_HISTOGRAM,STYLE_SOLID);
   SetIndexDrawBegin(1,SignalSMA);
   SetIndexDrawBegin(2,SignalSMA);
   IndicatorDigits(MarketInfo(Symbol(),MODE_DIGITS)+1);
//---- indicator buffers mapping
   if(!SetIndexBuffer(0,ind_buffer1) && !SetIndexBuffer(1,ind_buffer2) && !SetIndexBuffer(2,ind_buffer3))
      Print("cannot set indicator buffers!");
//---- name for DataWindow and indicator subwindow label
   IndicatorShortName("MACD("+FastEMA+","+SlowEMA+","+SignalSMA+")");
   SetIndexLabel(0,"MACD");
   SetIndexLabel(1,"Signal");
   SetIndexLabel(2,"Histogram");
//---- initialization done
   return(0);
  }
//+------------------------------------------------------------------+
//| Moving Averages Convergence/Divergence                           |
//+------------------------------------------------------------------+
int start()
  {
   int limit;
   int counted_bars=IndicatorCounted();
//---- check for possible errors
   if(counted_bars<0) return(-1);
//---- last counted bar will be recounted
   if(counted_bars>0) counted_bars--;
   limit=Bars-counted_bars;
//---- macd counted in the 1-st buffer
   for(int i=0; i<limit; i++)
      ind_buffer1[i]=iMA(NULL,0,FastEMA,0,MODE_EMA,PRICE_CLOSE,i)-iMA(NULL,0,SlowEMA,0,MODE_EMA,PRICE_CLOSE,i);
//---- signal line counted in the 2-nd buffer
   for(i=0; i<limit; i++)
      ind_buffer2[i]=iMAOnArray(ind_buffer1,Bars,SignalSMA,0,MODE_SMA,i);
   for(i=0; i<limit; i++)
      ind_buffer3[i]=2*(ind_buffer1[i]-ind_buffer2[i]);
//    if (ind_buffer3[i]<0)  SetIndexStyle(2,DRAW_HISTOGRAM,STYLE_SOLID,3,Red);
//---- done
   return(0);
  }
Comments