MACDBars
Download script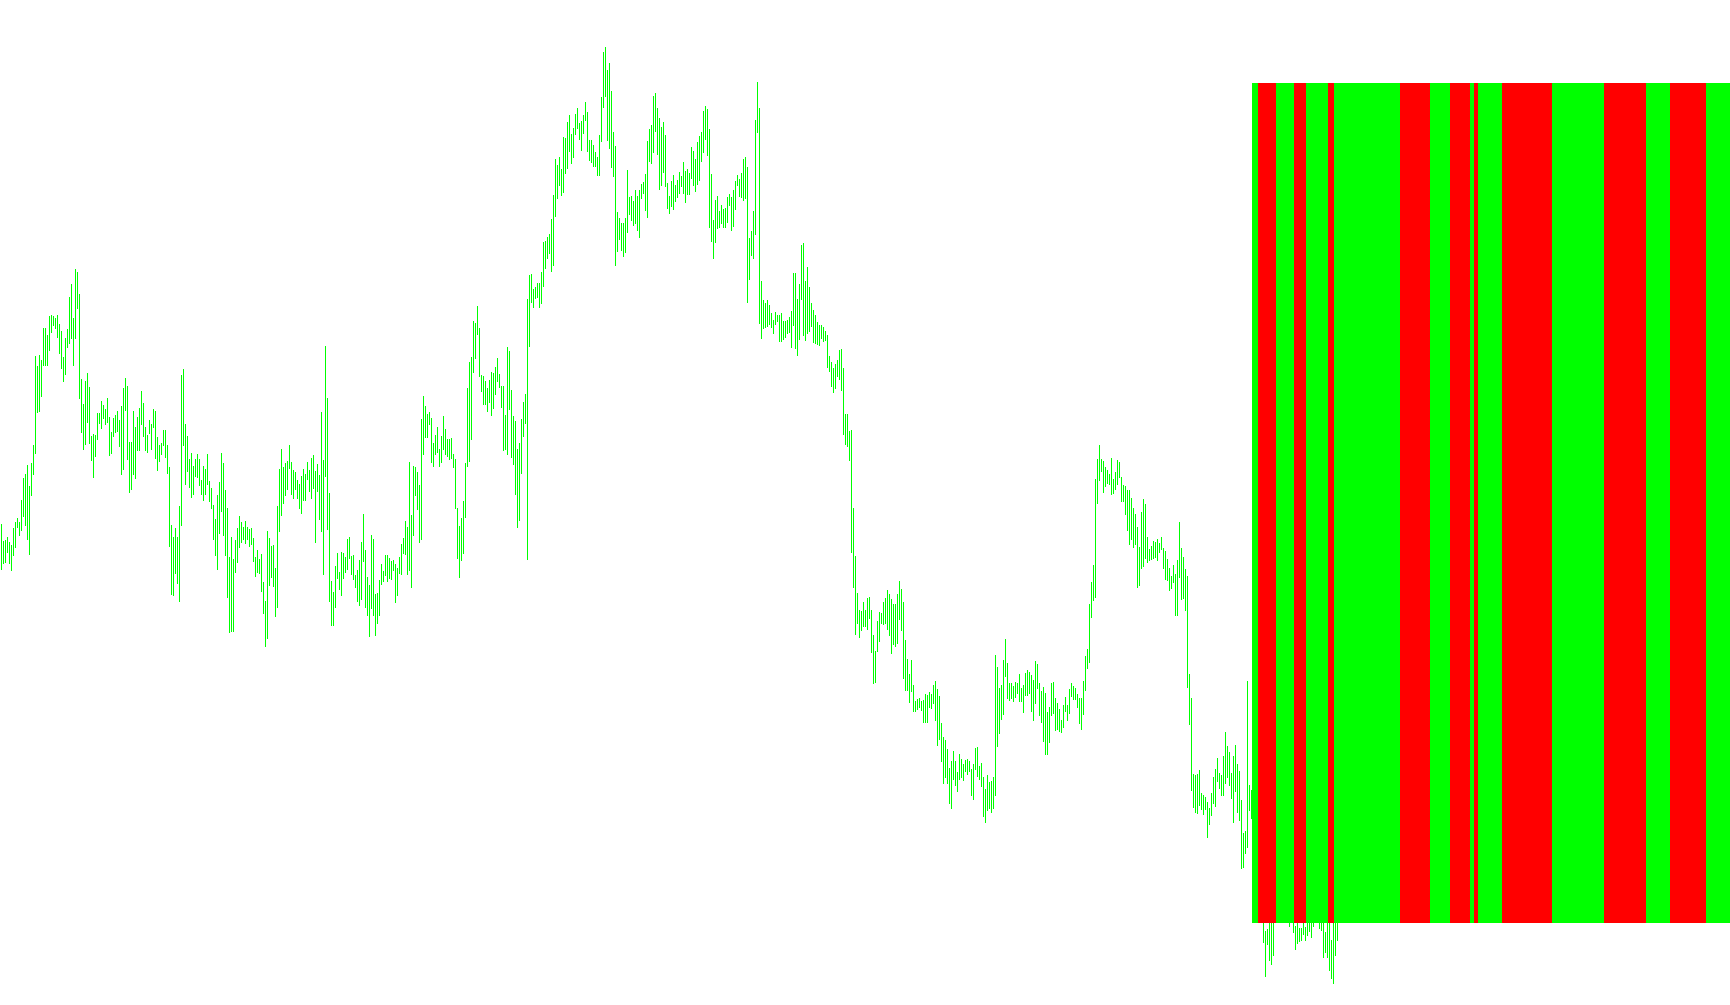
This tool is designed to provide traders with a visual representation of market momentum by utilizing the MACD (Moving Average Convergence Divergence) technical indicator. Unlike standard MACD displays that show fluctuating lines, this script simplifies the data into a clear, binary "Buy Zone" and "Sell Zone" visual on your chart.
Core Functionality
The logic operates by comparing two primary components of the MACD: the Main Line (representing the distance between two moving averages) and the Signal Line (an average of that main line).
Instead of requiring you to interpret complex line crossings or intersections, the script performs a constant comparison between these two values:
- Bullish Sentiment: When the Main Line is greater than or equal to the Signal Line, the script identifies this as a bullish state and highlights the "Buy Zone."
- Bearish Sentiment: When the Main Line falls below the Signal Line, the script recognizes a bearish shift and highlights the "Sell Zone."
Key Features & Customization
The script is highly flexible, allowing you to tailor the analysis to your specific trading style through several adjustable parameters:
- Multi-Timeframe Analysis: You can choose to view the momentum of the current chart or switch the logic to monitor a different timeframe (such as 1-minute, 1-hour, Daily, or Monthly) without changing your actual chart view.
- Customizable Sensitivity: Users can adjust the "Fast" and "Slow" moving averages, as well as the Signal smoothing period. This allows you to make the indicator more sensitive to quick price fluctuations or smoother for identifying long-term trends.
- Price Source Selection: You can define which price data the logic uses to calculate these moves—whether it be the standard Closing price, Opening price, High/Low prices, or weighted averages.
- Visual Clarity: The results are displayed as a histogram in a separate window at the bottom of your screen. It uses distinct colors (Green for Buy zones and Red for Sell zones) with a thickness that ensures high visibility during active trading.
Summary for Traders
Essentially, this script acts as a "sentiment filter." It processes the underlying math of the MACD to tell you which direction the momentum is currently leaning, stripping away the noise of moving lines and presenting you with a clear, colored map of market bias based on the timeframe and speed settings you prefer.
//+------------------------------------------------------------------+
//|                                      MACDBars.mq4 modified from  |
//|                                              mtt-ErgodicMACD.mq4 |
//|                   Copyright © 2004-07, MetaQuotes Software Corp. |
//|                                       http://www.metaquotes.net/ |
//+------------------------------------------------------------------+
#property  copyright "Copyright © 2004-07, mietectec"
#property  link      ""
//---- indicator settings
#property  indicator_separate_window
#property  indicator_buffers 2
#property  indicator_color1  Lime
#property  indicator_color2  Red
#property indicator_width1 4
#property indicator_width2 4
#property  indicator_minimum 0
#property  indicator_maximum 1

// MACD
extern string note1 = "Chart Time Frame";
extern string note2 = "0=current time frame";
extern string note3 = "1=M1, 5=M5, 15=M15, 30=M30";
extern string note4 = "60=H1, 240=H4, 1440=D1";
extern string note5 = "10080=W1, 43200=MN1";
extern int	TimeFrame	= 0;
extern string note6 = "MACD settings";
extern int FastEma = 12;
extern int SlowEma = 26;
extern int SignalSMMA = 9;
extern string note7 = "0=Close,1=Open,2=High,3=Low";
extern string note8 = "4=Median Price,5=Typical Price";
extern string note9 = "6=Weighted Price";
extern int PriceField = 0;
//extern string note10 = "Alert when cross over or down zero";
 bool PopUpAlert=true;
 bool EmailAlert=false;
extern string note11 = "Numbers of bars to calculate";
extern int MaximumBars=196;

//---- indicator buffers
double ExtMapBuffer1[];
double ExtMapBuffer2[];
string AlertPrefix;
string GetTimeFrameStr() {
   switch(TimeFrame)
   {
      case 1 : string TimeFrameStr="M1"; break;
      case 5 : TimeFrameStr="M5"; break;
      case 10 : TimeFrameStr="M10"; break;
      case 15 : TimeFrameStr="M15"; break;
      case 30 : TimeFrameStr="M30"; break;
      case 60 : TimeFrameStr="H1"; break;
      case 120 : TimeFrameStr="H2"; break;
      case 240 : TimeFrameStr="H4"; break;
      case 480 : TimeFrameStr="H8"; break;
      case 1440 : TimeFrameStr="D1"; break;
      case 10080 : TimeFrameStr="W1"; break;
      case 43200 : TimeFrameStr="MN1"; break;
      default : TimeFrameStr=Period(); break;
   }
   return (TimeFrameStr);
   }

//+------------------------------------------------------------------+
//| Custom indicator initialization function                         |
//+------------------------------------------------------------------+
int init()
  {
   SetIndexStyle(0,DRAW_HISTOGRAM,STYLE_SOLID,4,indicator_color1);
   SetIndexBuffer(0,ExtMapBuffer1);
   SetIndexLabel(0,"BuyZone");

   SetIndexStyle(1,DRAW_HISTOGRAM,STYLE_SOLID,4,indicator_color2);
   SetIndexBuffer(1,ExtMapBuffer2);
   SetIndexLabel(1,"SellZone");
   if (TimeFrame == 0) TimeFrame = Period();
   IndicatorShortName(GetTimeFrameStr() + " MACD ("+FastEma+","+SlowEma+","+SignalSMMA+")");
	IndicatorDigits(0);
   AlertPrefix=Symbol()+" ("+GetTimeFrameStr()+"):  ";
   return(0);
  }
//+------------------------------------------------------------------+
int deinit()
  {
   return(0);
  }
//+------------------------------------------------------------------+
/*
bool NewBar()
{
   static datetime lastbar;
   datetime curbar = Time[0];
   if(lastbar!=curbar)
   {
      lastbar=curbar;
      return (true);
   }
   else
   {
      return(false);
   }
}
*/
//+------------------------------------------------------------------+
int start()
  {
   datetime TimeArray[];
   int i, banzai, crossupzero, crossdownzero;

   crossupzero =0;
   crossdownzero=0;
   for (i=0, banzai=0; i<MaximumBars; i++)
       {
        ArrayCopySeries(TimeArray,MODE_TIME,Symbol(),TimeFrame);
        if (Time[i]<TimeArray[banzai]) banzai++;
        double indMacdMain0 = iMACD(NULL,TimeFrame,FastEma, SlowEma, SignalSMMA,PriceField,0,banzai);
        double indMacdSignal0 = iMACD(NULL,TimeFrame,FastEma, SlowEma, SignalSMMA,PriceField,1,banzai);

        if (indMacdMain0 >= indMacdSignal0) {
           ExtMapBuffer1[i] = 1;
           ExtMapBuffer2[i] = 0;
           crossupzero = crossupzero + 1;
           crossdownzero=0;
          }
        else if (indMacdMain0 < indMacdSignal0 ) {
           ExtMapBuffer2[i] = 1;
           ExtMapBuffer1[i] = 0;
           crossdownzero = crossdownzero + 1;
           crossupzero =0;
          }
/*
       if (PopUpAlert && NewBar ()) {
            if (crossupzero == 1 && NewBar ())
               Alert(crossupzero+AlertPrefix+" MACD ("+FastEma+","+SlowEma+","+SignalSMMA+") crosses UP zero\nBUY signal @ Ask = $",Ask,"; Bid = $",Bid,"\nDate & Time = ",TimeToStr(CurTime(),TIME_DATE)," ",TimeHour(CurTime()),":",TimeMinute(CurTime()));
            if (crossdownzero == 1 && NewBar ())
               Alert(AlertPrefix+" MACD ("+FastEma+","+SlowEma+","+SignalSMMA+") crosses DOWN zero\nSELL signal @ Ask = $",Ask,"; Bid = $",Bid,"\nDate & Time = ",TimeToStr(CurTime(),TIME_DATE)," ",TimeHour(CurTime()),":",TimeMinute(CurTime()));
       }
       if (EmailAlert) {
            if (crossupzero == 1)
               Alert(AlertPrefix+" MACD ("+FastEma+","+SlowEma+","+SignalSMMA+") crosses UP zero\nBUY signal @ Ask = $",Ask,"; Bid = $",Bid,"\nDate & Time = ",TimeToStr(CurTime(),TIME_DATE)," ",TimeHour(CurTime()),":",TimeMinute(CurTime()));
            if (crossdownzero == 1)
               Alert(AlertPrefix+" MACD ("+FastEma+","+SlowEma+","+SignalSMMA+") crosses DOWN zero\nSELL signal @ Ask = $",Ask,"; Bid = $",Bid,"\nDate & Time = ",TimeToStr(CurTime(),TIME_DATE)," ",TimeHour(CurTime()),":",TimeMinute(CurTime()));
       }
*/
       }
      return(0);
  }
//+------------------------------------------------------------------+
Comments