Grid Builder
Download script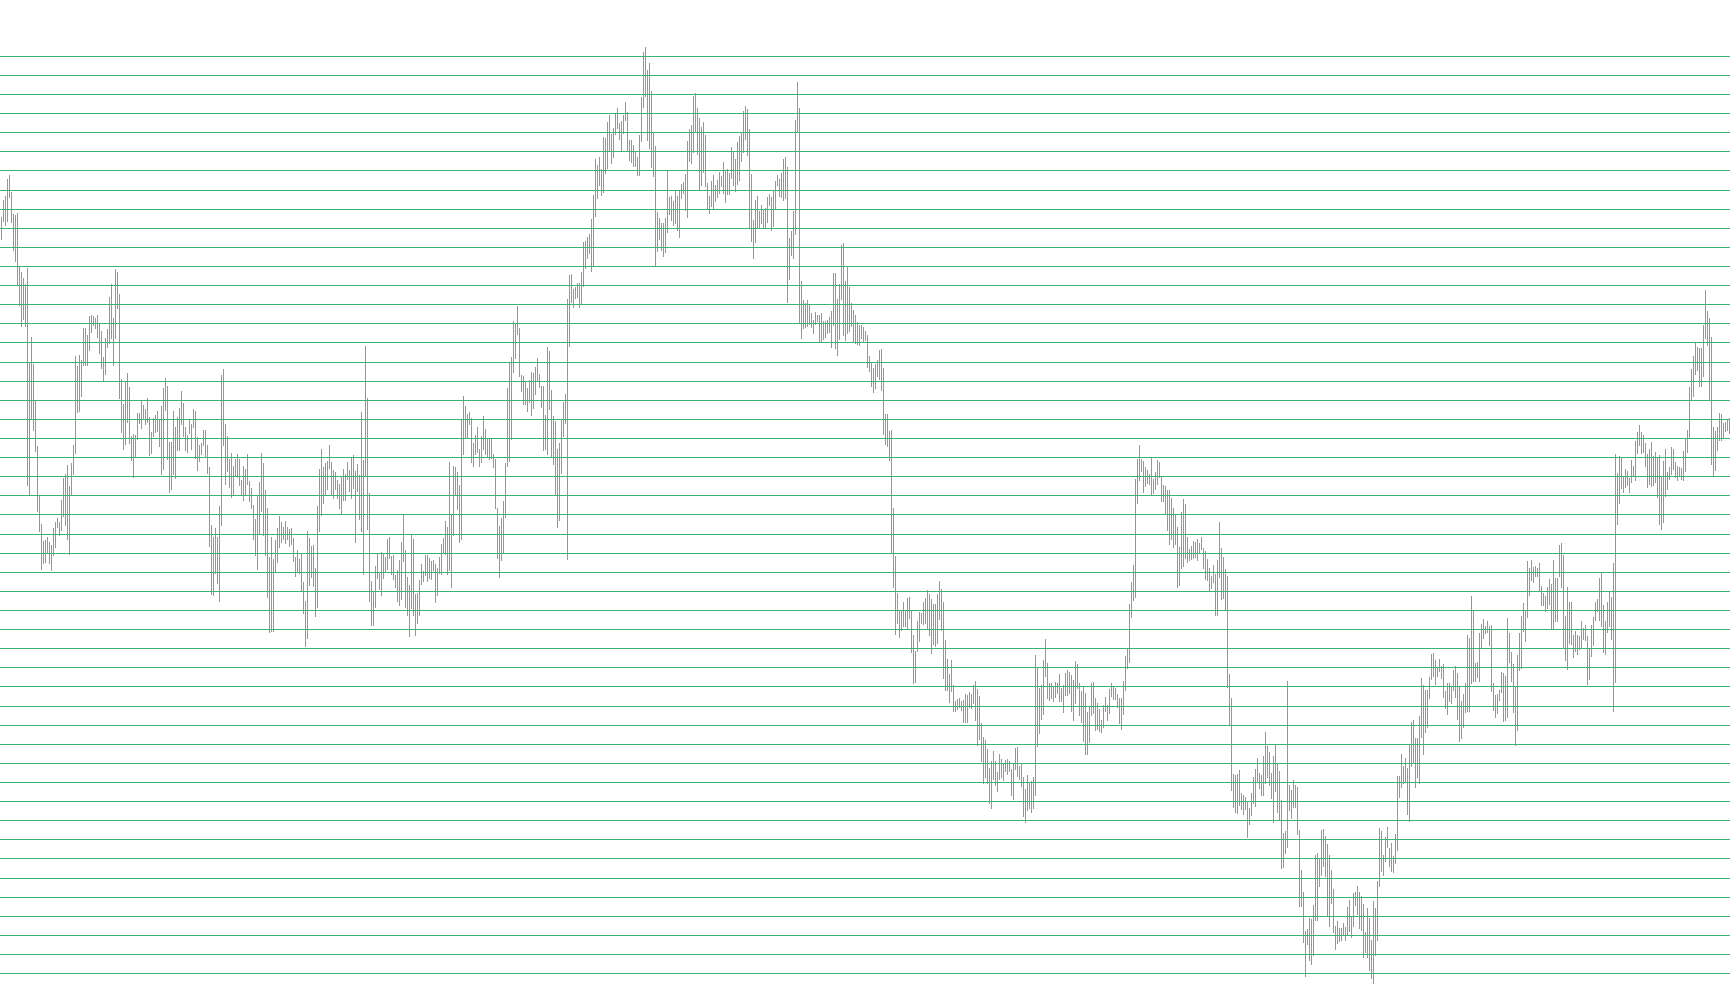
Tool Overview: Automated Price Grid Generator
This script is designed to automate the creation of visual price levels on your trading chart, forming a structured "grid" based on recent market activity. Instead of manually drawing horizontal lines at specific price points, this tool calculates the relevant price range and populates it with consistent, evenly spaced markers to help traders identify key zones more efficiently.
How the Logic Works
1. Dynamic Range Identification The script automatically scans the most recent price action on your chart. It specifically looks back at a small window of historical data to identify two critical points:
- The highest price reached in that period.
- The lowest price reached in that period.
By identifying these extremes, the tool establishes the "boundaries" for your grid, ensuring that the visual aids stay relevant to the current market movement rather than being fixed at arbitrary numbers.
2. Grid Spacing and Scaling
The tool uses a customizable spacing setting (defined by the GridSpace parameter). It takes the high and low price boundaries identified in the previous step and calculates how many lines are needed to fill that space. It then applies a mathematical divisor to ensure that the grid lines are placed at equal intervals, providing a uniform visual layout across the entire trading area.
3. Automated Visual Rendering Once the boundaries and spacing are calculated, the script performs the following actions:
- Line Creation: It automatically draws horizontal lines at every calculated interval between the high and low points.
- Styling: Each line is assigned a specific visual style (solid) and a distinct color (Medium Sea Green) to ensure they are clearly visible on your chart.
- Unique Identification: The tool gives each line a unique identity based on its price level. This allows the script to check if a line already exists before drawing a new one, preventing the chart from becoming cluttered with redundant objects.
4. Automatic Cleanup To keep your workspace clean, the script includes a maintenance routine. When the tool is removed or updated, it clears the previously drawn grid lines from the chart. This ensures that old price levels from previous sessions don't remain on your screen, allowing for a fresh layout every time you use the tool.
Summary for the Trader
This tool essentially "maps" the current trading territory for you. It finds where the price has been recently and draws a roadmap of horizontal levels at regular intervals. This allows you to see the scale of price movements more clearly and helps in identifying structural patterns without the manual effort of drawing individual lines.
//+------------------------------------------------------------------+
//|                                      2Extreme4U Grid Builder.mq4 |
//|                     Copyright © 2005, Siddiqi, Alejandro Galindo |
//|                                              http://elCactus.com |
//+------------------------------------------------------------------+
#property copyright "Copyright © 2005, Siddiqi, Alejandro Galindo"
#property link      "http://elCactus.com"

#property indicator_chart_window
extern int GridSpace=50;
//+------------------------------------------------------------------+
//| Custom indicator initialization function                         |
//+------------------------------------------------------------------+
int init()
  {
//---- indicators
//----
   return(0);
  }
//+------------------------------------------------------------------+
//| Custor indicator deinitialization function                       |
//+------------------------------------------------------------------+
int deinit()
  {
//----
   double shift=0;
   double HighPrice=0;
   double LowPrice=0;

   double Divisor = 0.1/Point;

   HighPrice = MathRound(High[Highest(NULL,0,2, Bars - 2,  2)] * Divisor);
   //SL = High[Highest(MODE_HIGH, SLLookback, SLLookback)];
   LowPrice = MathRound(Low[Lowest(NULL,0,1, Bars - 1, 2)] * Divisor);
   for(shift=LowPrice;shift<=HighPrice;shift++)
   {
      ObjectDelete("Grid"+shift);
   }
//----
   return(0);
  }
//+------------------------------------------------------------------+
//| Custom indicator iteration function                              |
//+------------------------------------------------------------------+
int start()
  {
   int    counted_bars=IndicatorCounted();
   double I=0;
   double HighPrice=0;
   double LowPrice=0;
   int GridS=0;
   int SL=0;
//----

   double Divisor = 0.1/Point;

   HighPrice = MathRound(High[Highest(NULL,0,MODE_HIGH, Bars - 2, 2)] * Divisor);
   //SL = High[Highest(MODE_HIGH, SLLookback, SLLookback)];
   LowPrice = MathRound(Low[Lowest(NULL,0,MODE_LOW, Bars - 1, 2)] * Divisor);
   GridS = GridSpace / 10;

   for(I=LowPrice;I<=HighPrice;I++)
   {
	  //Print("mod(I, GridSpace): " + MathMod(I, GridS) + " I= " + I);
	  //Print(LowPrice + " " + HighPrice);
	  if (MathMod(I, GridS) == 0)
	  {
         if (ObjectFind("Grid"+I) != 0)
         {
            ObjectCreate("Grid"+I, OBJ_HLINE, 0, Time[1], I/Divisor);
            ObjectSet("Grid"+I, OBJPROP_STYLE, STYLE_SOLID);
            ObjectSet("Grid"+I, OBJPROP_COLOR, MediumSeaGreen);
         }
		 //MoveObject(I + "Grid", OBJ_HLINE, Time[Bars - 2], I/1000, Time[1], I/1000, MediumSeaGreen, 1, STYLE_SOLID);
	  }
   }
//----
   return(0);
  }
//+------------------------------------------------------------------+
Comments