Hans Indicator
Download script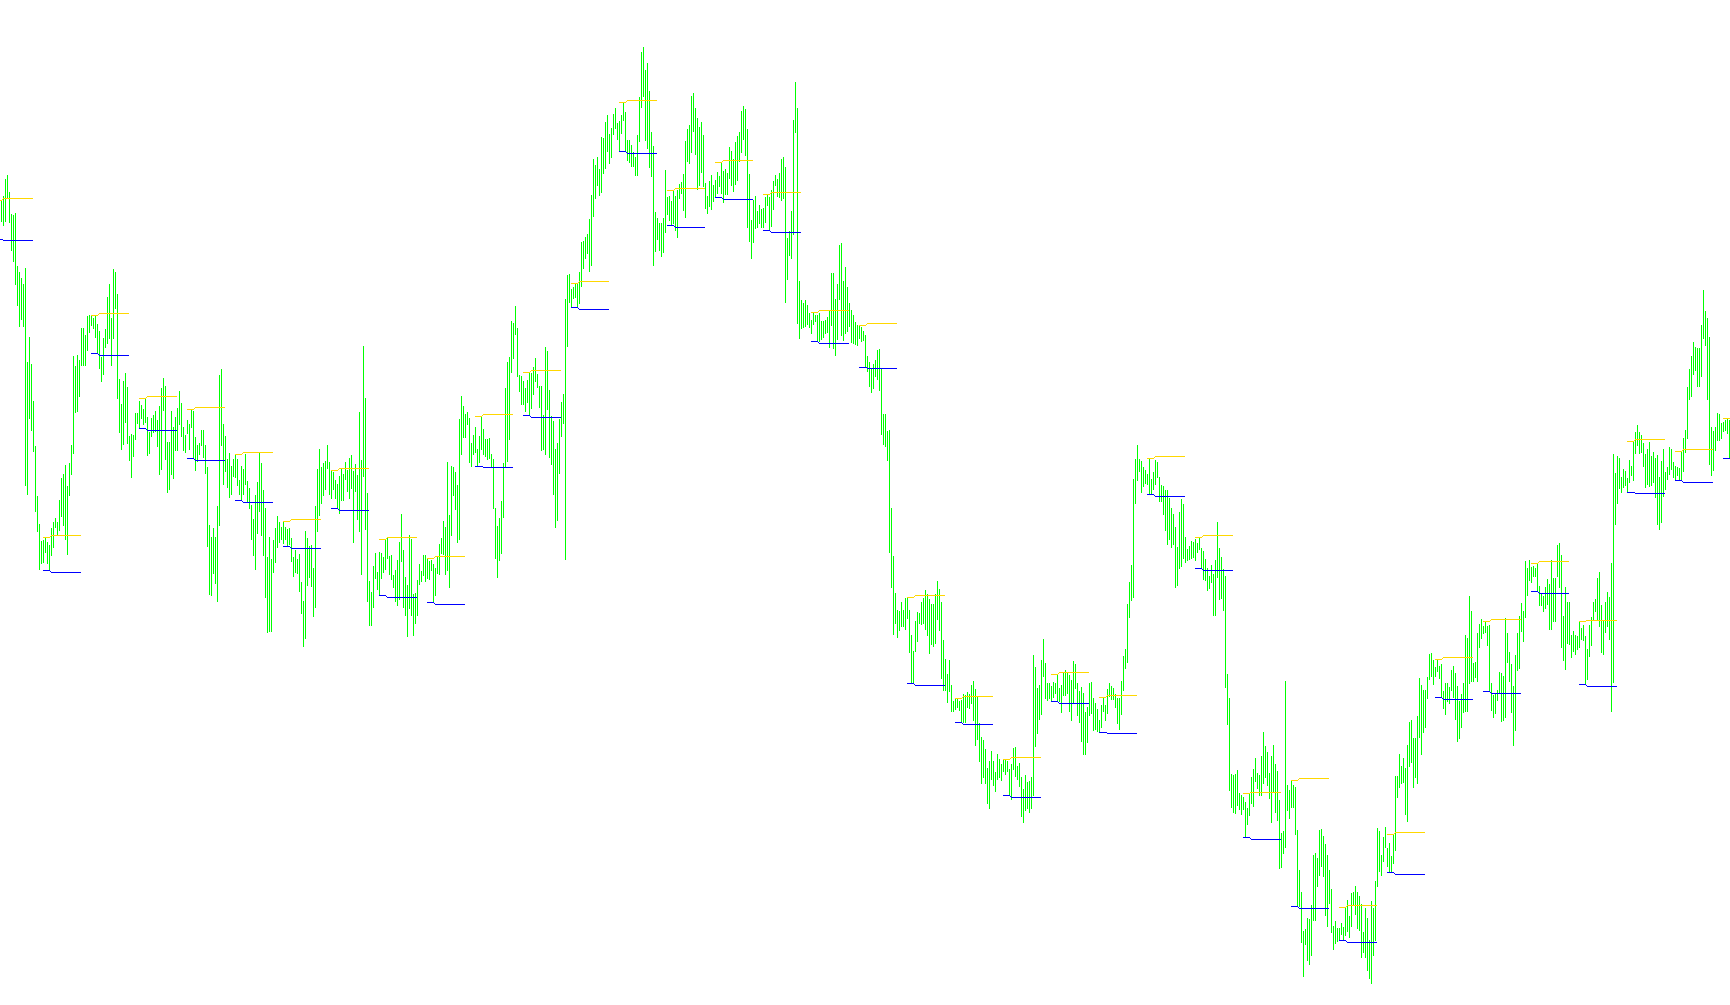
This script is designed as a visual trading tool for MetaTrader 4, specifically tailored to help traders identify potential "breakout" opportunities in currency pairs like EUR/USD and GBP/USD. Instead of using complex mathematical formulas, it relies on identifying price boundaries established during specific times of the day.
How the Logic Works
The tool operates by segmenting the trading day into distinct time windows. It monitors the price action during these windows to establish "zones" based on the highest and lowest prices reached.
1. Time Zone Management The script is designed to be flexible regarding geography. It allows the user to account for their local time zone versus the market's destination time zone. This ensures that the "time windows" remain accurate regardless of where the trader is located in the world.
2. Defined Observation Windows The logic identifies three specific phases throughout the day:
- Period 1: An early morning window.
- Period 2: A mid-day window.
- Remaining Day: The period following the second window.
3. High and Low Tracking For the first two periods, the script scans every price movement (the "Highs" and "Lows"). It captures the extreme points reached during these specific hours. Once a period concludes, the script takes those extreme values and projects them forward as horizontal boundaries (zones) for the rest of the day.
4. Buffer Zone Application To give traders some breathing room, the script includes a customizable "Pips For Entry" setting. When it draws the breakout zones, it automatically expands the upper and lower boundaries by this amount. This prevents the tool from signaling a "breakout" on tiny, insignificant price fluctuations, ensuring that only meaningful movements are highlighted.
5. Visual Representation The script performs these calculations in the background and handles the visual heavy lifting for the user:
- It draws the calculated boundaries directly on the chart.
- It automatically resets all data at the start of each new day to begin the cycle fresh.
- It provides a clear visual cue (an arrow) to highlight specific signals based on the price crossing these established zones.
Summary for the Trader
Essentially, this tool tells you: "During these specific hours yesterday/today, this is how high and low the price went. If the price breaks above or below those levels now, it represents a significant shift in momentum." It automates the tedious task of manually measuring highs and lows from previous sessions, allowing you to focus on executing trades when the breakout occurs.
//+------------------------------------------------------------------+
//|  TZ-Breaktout.mq4                                                |
//|  Shimodax                                                        |
//|                                                                  |
//+------------------------------------------------------------------+

#property copyright "Copyright Shimodax"
#property link      "http://www.strategybuilderfx.com/forums/showthread.php?t=15439"


/* Introduction:

   Draw ranges for "Simple Combined Breakout System for EUR/USD and GBP/USD" thread
   (see http://www.strategybuilderfx.com/forums/showthread.php?t=15439)

   LocalTimeZone: TimeZone for which MT4 shows your local time,
                  e.g. 1 or 2 for Europe (GMT+1 or GMT+2 (daylight
                  savings time).  Use zero for no adjustment.

                  The MetaQuotes demo server uses GMT +2.
   Enjoy  :-)

   Markus

*/


#property indicator_chart_window
#property indicator_buffers 5
#property indicator_color1 Gray
#property indicator_color2 Gray
#property indicator_color3 LightGray
#property indicator_color4 LightGray
#property indicator_color5 Blue


extern int LocalTimeZone= 2;
extern int DestTimeZone= 6;
extern int PipsForEntry= 5;


double Zone1Upper[];
double Zone2Upper[];
double Zone1Lower[];
double Zone2Lower[];
double SignalsBuffer[];


//+------------------------------------------------------------------+
//| Custom indicator initialization function                         |
//+------------------------------------------------------------------+
int init()
{
   SetIndexStyle(0,DRAW_LINE);
   SetIndexBuffer(0,Zone1Upper);
   SetIndexEmptyValue(0, 0.0);

   SetIndexStyle(1,DRAW_LINE);
   SetIndexBuffer(1,Zone1Lower);
   SetIndexEmptyValue(1, 0.0);

   SetIndexStyle(2,DRAW_NONE);
   SetIndexBuffer(2,Zone2Upper);
   SetIndexEmptyValue(2, 0.0);

   SetIndexStyle(3,DRAW_NONE);
   SetIndexBuffer(3,Zone2Lower);
   SetIndexEmptyValue(3, 0.0);

   SetIndexStyle(4,DRAW_ARROW);
   SetIndexArrow(4, 156);
   SetIndexBuffer(4, SignalsBuffer);

   return(0);
}

int deinit()
{

   return(0);
}

//+------------------------------------------------------------------+
//| Custom indicator iteration function                              |
//+------------------------------------------------------------------+
int start()
{
   int counted_bars= IndicatorCounted(),
         lastbar, result;

   if (Bars<=100)
      return(0);

   if (counted_bars>0)
      counted_bars--;

   lastbar= Bars - counted_bars;

   BreakoutRanges(0, lastbar, LocalTimeZone, DestTimeZone);

   return(0);
}


//+------------------------------------------------------------------+
//| Compute index of first/last bar of yesterday and today           |
//+------------------------------------------------------------------+
int BreakoutRanges(int offset, int lastbar, int tzlocal, int tzdest)
{
   int i, j, k,
       tzdiff= tzlocal - tzdest,
       tzdiffsec= tzdiff*3600,
       tidxstart[2]= { 0, 0},
       tidxend[2]= { 0, 0 };
   double thigh[2]= { 0.0, 0.0 },
           tlow[2]= { 99999.9, 99999.9 };
   string tfrom[3]= { "04:00", "08:00" ,  /*rest of day: */ "12:00"},
          tto[3]=   { "08:00", "12:00",   /*rest of day: */ "24:00" },
          tday;
   bool inperiod= -1;
   datetime timet;


   //
   // search back for the beginning of the day
   //
   tday= TimeToStr(Time[lastbar]-tzdiffsec, TIME_DATE);
   for (  ; lastbar<Bars; lastbar++) {
      if (TimeToStr(Time[lastbar] - tzdiffsec, TIME_DATE)!=tday) {
         lastbar--;
         break;
      }
   }


   //
   // find the high/low for the two periods and carry them forward through the day
   //
   tday= "XXX";
   for (i= lastbar; i>=offset; i--) {

      timet= Time[i] - tzdiffsec;   // time of this bar

      string timestr= TimeToStr(timet, TIME_MINUTES),    // current time HH:MM
             thisday= TimeToStr(timet, TIME_DATE);       // current date


      //
      // for all three periods (first period, second period, rest of day)
      //
      for (j= 0; j<3; j++) {

         if (tfrom[j]<=timestr && timestr<tto[j]) {   // Bar[i] in this period

            if (inperiod!=j) { // entered new period, so last one is completed

               if (j>0) {      // now draw high/low back over the recently completed period

                  for (k= tidxstart[j-1]; k>=tidxend[j-1]; k--) {
                     if (j-1==0) {
                        Zone1Upper[k]= thigh[j-1];
                        Zone1Lower[k]= tlow[j-1];
                     }

                     if (j-1==1) {
                        Zone2Upper[k]= thigh[j-1];
                        Zone2Lower[k]= tlow[j-1];
                     }
                  }
               }

               inperiod= j;   // remember current period
            }

            if (inperiod==2)   // inperiod==2 (end of day) is just to check completion of zone 2
               break;


            // for the current period find idxstart, idxend and compute high/low
            if (tidxstart[j]==0) {
               tidxstart[j]= i;
               tday= thisday;
            }

            tidxend[j]= i;

            thigh[j]= MathMax(thigh[j], High[i]);
            tlow[j]= MathMin(tlow[j], Low[i]);
         }
      }


      //
      // carry forward the periods for which we have definite high/lows
      //
      if (inperiod>=1 && tday==thisday) { // first time period completed
         Zone1Upper[i]= thigh[0] + PipsForEntry*Point;
         Zone1Lower[i]= tlow[0] - PipsForEntry*Point;

         if (inperiod>=2) {   // second period completed
            Zone2Upper[i]= thigh[1] + PipsForEntry*Point;
            Zone2Lower[i]= tlow[1] - PipsForEntry*Point;
         }
      }
      else {   // none yet to carry forward (zero to clear old values, e.g. from switching timeframe)
         Zone1Upper[i]= 0;
         Zone1Lower[i]= 0;
         Zone2Upper[i]= 0;
         Zone2Lower[i]= 0;
      }


      //
      // at the beginning of a new day reset everything
      //
      if (tday!="XXX" && tday!=thisday) {
         Print("#", i, "new day ", thisday, "/", tday);

         tday= "XXX";

         inperiod= -1;

         for (j= 0; j<2; j++) {
            tidxstart[j]= 0;
            tidxend[j]= 0;

            thigh[j]= 0;
            tlow[j]= 99999;
         }
      }
   }

   return (0);
}
Comments