GraphOnGrap
Download script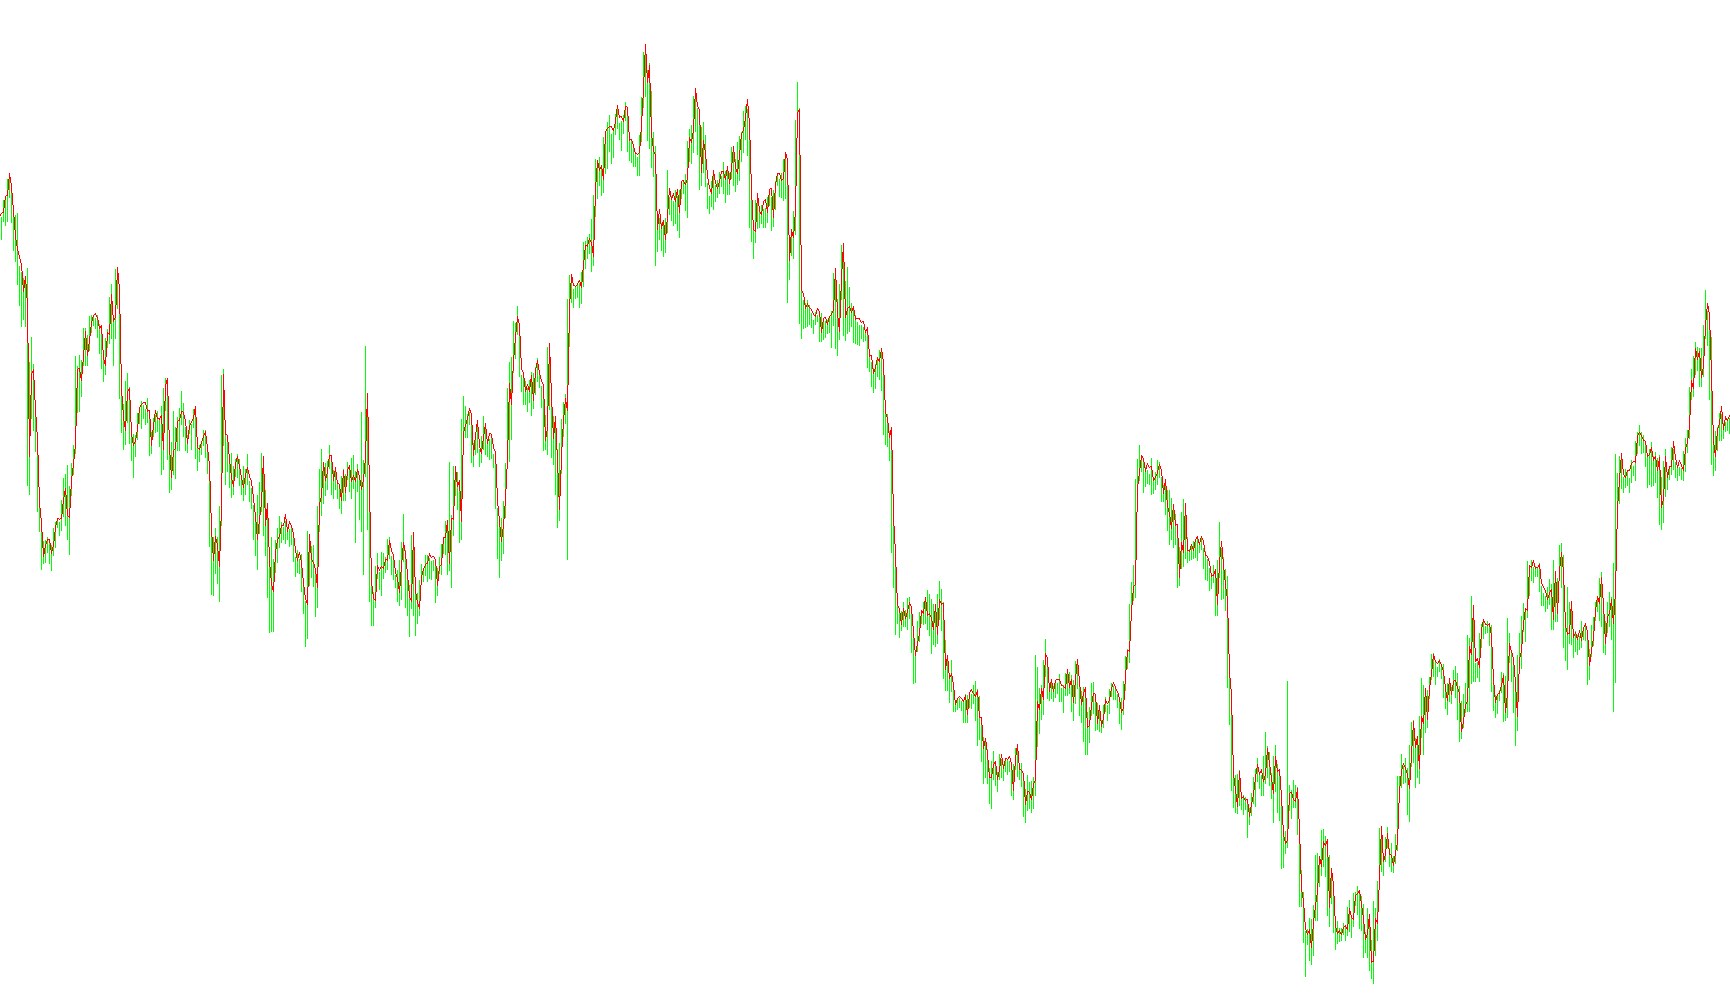
This technical script is designed to provide a visual representation of specific price data from a secondary currency pair or asset on your trading platform. Rather than cluttering your main chart, it opens in a separate window, allowing you to monitor the price action of another instrument simultaneously.
Key Functionalities:
- Customizable Asset Monitoring: The script allows you to define exactly which financial instrument you wish to track (for example, EURUSD). This makes it easy to keep an eye on a "base" currency or a correlated asset while you trade on your primary chart.
- Flexible Price Selection: You have the option to choose what specific type of price data is plotted. The logic provides three distinct modes:
- Open: Tracks the price at which the candle began.
- Close: Tracks the final price at which the candle ended.
- Medium: Calculates and plots the exact midpoint between the opening and closing prices of the candle.
- Visual Customization: The script allows for easy adjustments to the visual presentation, such as selecting the line color to ensure it remains clear and legible against your workspace background.
- Historical Data Retrieval: The logic automatically scans through a significant range of historical data points (up to 1,000 bars) to ensure that the resulting graph provides a consistent and continuous line for your analysis.
In summary, this tool serves as a secondary "dashboard" view, giving you the ability to overlay relevant market information from different symbols in a clean, organized manner.
Price Data Components
Miscellaneous
12
Views
0
Downloads
0
Favorites
GraphOnGrap
//+------------------------------------------------------------------+
//|                                                  GraphOnGrap.mq4 |
//|                          Gryb Alexander alexandergrib@rambler.ru |
//|                                                                  |
//+------------------------------------------------------------------+
#property copyright "Gryb Alexander alexandergrib@rambler.ru"
#property link      ""

#property indicator_separate_window
#property indicator_buffers 1
extern string comment1 = "Âàëþòíàÿ ïàðà";
extern string symbol = "EURUSD";
extern string comment2 = "Òàéìôðåéì. 0 - òô òåêóùåãî ãðàôèêà";
extern int timeFrame = 0;
extern string comment3 = "Öåíà, ïî êîòîðîé ñòðîåòñÿ ãðàôèê ïàðû(Open, Close, Medium)";
extern string price = "Open";
extern color indicatorColor=Red;
double cot1[];
//+------------------------------------------------------------------+
//| Custom indicator initialization function                         |
//+------------------------------------------------------------------+
int init()
  {
//---- indicators
    SetIndexBuffer(0,cot1);
    SetIndexStyle(0,DRAW_LINE,NULL,NULL,indicatorColor);
    IndicatorShortName("Ãðàôèê "+symbol);
//----
   return(0);
  }
//+------------------------------------------------------------------+
//| Custom indicator deinitialization function                       |
//+------------------------------------------------------------------+
int deinit()
  {
//----

//----
   return(0);
  }
//+------------------------------------------------------------------+
//| Custom indicator iteration function                              |
//+------------------------------------------------------------------+
int start()
  {
   int    counted_bars=IndicatorCounted();
//----
    for(int k = 0;k<1000;k++)
    {
     if(price == "Open") cot1[k]=iOpen(symbol,0,k);
     if(price == "Close") cot1[k]=iClose(symbol,0,k);
     if(price == "Medium") cot1[k]=((iOpen(symbol,0,k)+iClose(symbol,0,k))/2);
    }
//----
   return(0);
  }
//+------------------------------------------------------------------+
Comments