Grid Builder_001
Download script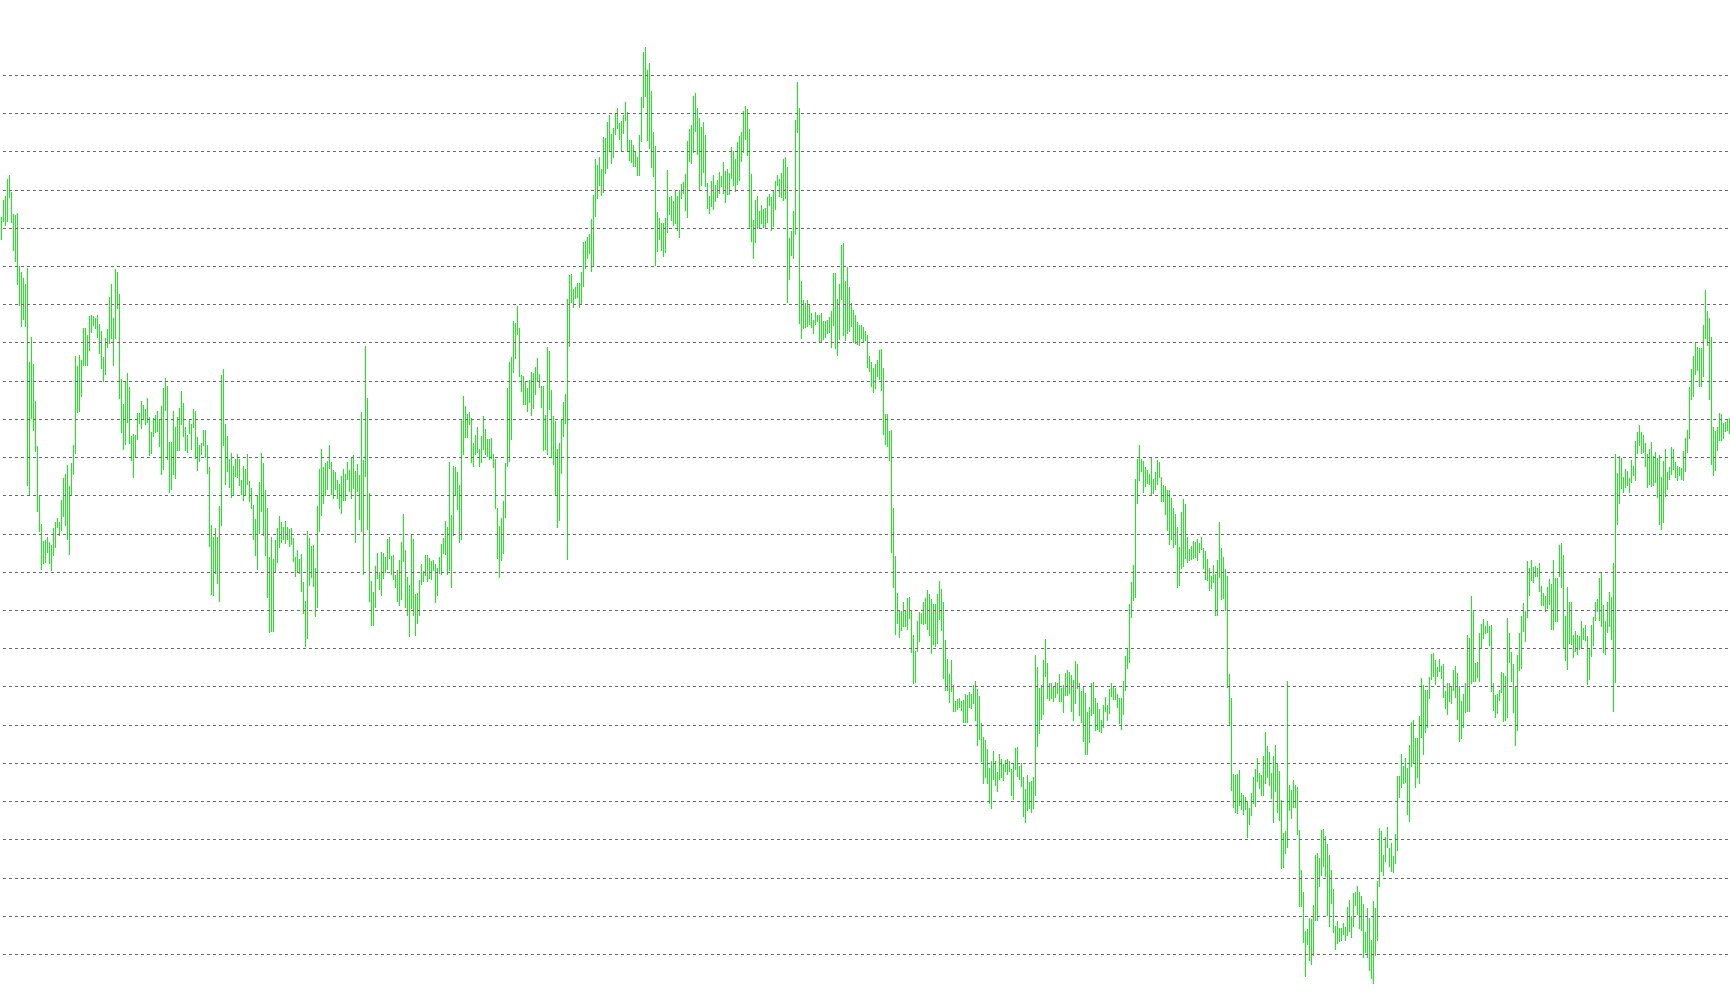
This tool is designed as a visual aid for traders using MetaTrader, specifically to help map out "grid" levels on a price chart. Instead of manually drawing dozens of horizontal lines, the script automates this process based on recent market activity.
How the Logic Works
1. Identifying the Price Range The script first scans the recent history of the market to determine the current price boundaries. It automatically looks for the highest and lowest price points reached over a specific period. This ensures that the grid is always relevant to the current "action" on the screen rather than being fixed to a static number.
2. Dynamic Grid Calculation Once the high and low boundaries are established, the script calculates a series of intermediate price levels between them. It uses a customizable spacing factor (the "Grid Space") to decide how many lines to draw. The goal is to create an even distribution of horizontal markers across the entire visible range.
3. Automated Visual Mapping The script then works through every price point in that range. If a price point lands on a designated "step" according to the grid spacing, the script automatically places a horizontal line on your chart. These lines are styled as dotted markers, providing a clean, non-intrusive visual guide for identifying potential support or resistance zones.
4. Automatic Cleanup To keep your charts organized and prevent clutter from old data, the script includes a self-cleaning mechanism. When the indicator is removed or reset, it identifies the lines it previously drew based on the price range and clears them from the screen. This ensures that your chart remains tidy and only displays the grid relevant to the current market conditions.
Key Benefits for the User
- Precision: Provides a perfectly symmetrical layout of price levels, which is helpful for executing grid-based trading strategies.
- Efficiency: Saves significant time by eliminating the need to manually draw individual lines at regular intervals.
- Adaptability: Because it calculates based on recent highs and lows, the grid "moves" with the market, staying centered where the price action is currently happening.
//+------------------------------------------------------------------+
//|                                      2Extreme4U Grid Builder.mq4 |
//|                     Copyright © 2005, Siddiqi, Alejandro Galindo |
//|                                              http://elCactus.com |
//+------------------------------------------------------------------+
#property copyright "Copyright © 2005, Siddiqi, Alejandro Galindo"
#property link      "http://elCactus.com"

#property indicator_chart_window
#property indicator_color1 DimGray
extern int GridSpace = 100;
//+------------------------------------------------------------------+
//| Custom indicator initialization function                         |
//+------------------------------------------------------------------+
int init()
  {
//---- indicators
//----
   return(0);
  }
//+------------------------------------------------------------------+
//| Custor indicator deinitialization function                       |
//+------------------------------------------------------------------+
int deinit()
  {
//----
   double shift=0;
   double HighPrice=0;
   double LowPrice=0;

   double Divisor = 0.1/Point;

   HighPrice = MathRound(High[Highest(NULL,0,2, Bars - 2,  2)] * Divisor);
   //SL = High[Highest(MODE_HIGH, SLLookback, SLLookback)];
   LowPrice = MathRound(Low[Lowest(NULL,0,1, Bars - 1, 2)] * Divisor);
   for(shift=LowPrice;shift<=HighPrice;shift++)
   {
      ObjectDelete("Grid"+shift);
   }
//----
   return(0);
  }
//+------------------------------------------------------------------+
//| Custom indicator iteration function                              |
//+------------------------------------------------------------------+
int start()
  {
   int    counted_bars=IndicatorCounted();
   double I=0;
   double HighPrice=0;
   double LowPrice=0;
   int GridS=0;
   int SL=0;
//----

   double Divisor = 0.1/Point;

   HighPrice = MathRound(High[Highest(NULL,0,MODE_HIGH, Bars - 2, 2)] * Divisor);
   //SL = High[Highest(MODE_HIGH, SLLookback, SLLookback)];
   LowPrice = MathRound(Low[Lowest(NULL,0,MODE_LOW, Bars - 1, 2)] * Divisor);
   GridS = GridSpace / 10;

   for(I=LowPrice;I<=HighPrice;I++)
   {
	  //Print("mod(I, GridSpace): " + MathMod(I, GridS) + " I= " + I);
	  //Print(LowPrice + " " + HighPrice);
	  if (MathMod(I, GridS) == 0)
	  {
         if (ObjectFind("Grid"+I) != 0)
         {
            ObjectCreate("Grid"+I, OBJ_HLINE, 0, Time[1], I/Divisor);
            ObjectSet("Grid"+I, OBJPROP_STYLE, STYLE_DOT);
            ObjectSet("Grid"+I, OBJPROP_COLOR,indicator_color1);
         }
		 //MoveObject(I + "Grid", OBJ_HLINE, Time[Bars - 2], I/1000, Time[1], I/1000, MediumSeaGreen, 1, STYLE_SOLID);
	  }
   }
//----
   return(0);
  }
//+------------------------------------------------------------------+
Comments