Grid Builder_v1
Download script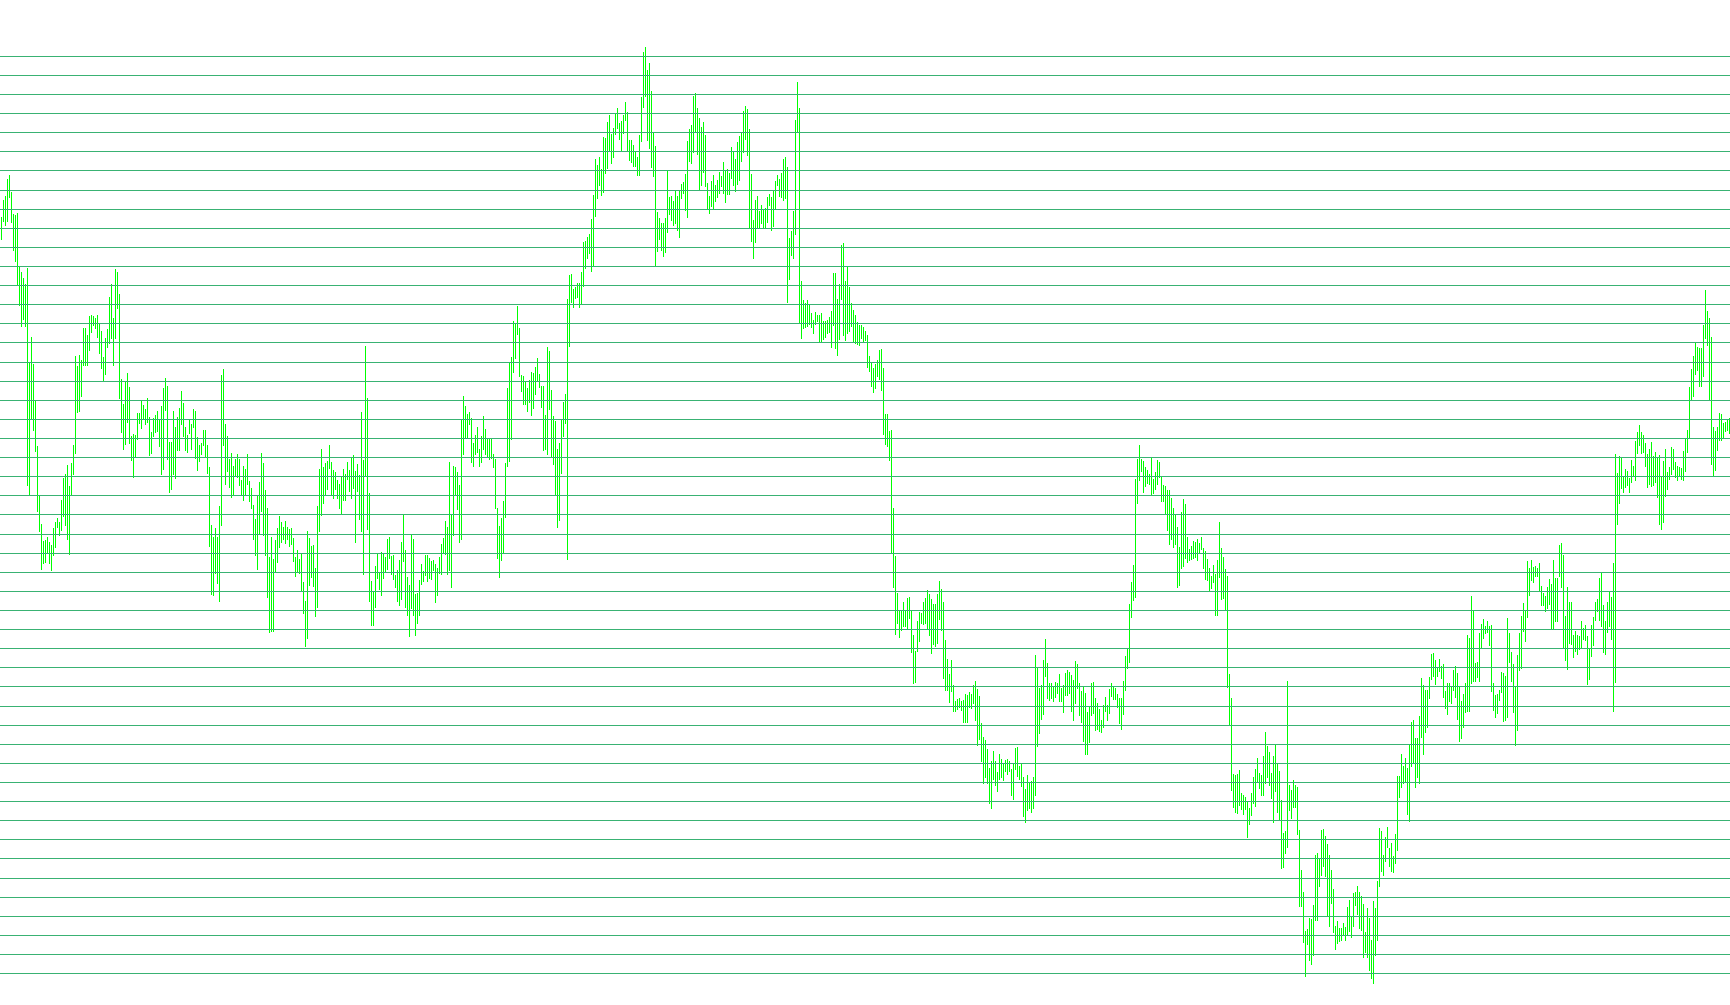
This tool is designed to automatically generate a visual price grid on your trading chart. It simplifies the way traders view price levels by identifying significant historical boundaries and drawing consistent horizontal lines across specific intervals.
Core Functionality
The script analyzes recent market data to determine the "trading zone" currently in view. It specifically looks back at the highest and lowest prices reached during a set period to establish the boundaries of the grid. Instead of manually placing hundreds of lines, the tool calculates these boundaries automatically and fills the space between them with a structured layout.
How it Works
- Dynamic Range Detection: The script identifies the peak high and the low point from recent price action. This ensures that the grid is always relevant to the current market movement rather than being fixed to a static price.
- Automatic Grid Generation: Based on a user-defined spacing (the "Grid Space"), the tool places horizontal lines at regular intervals between the identified high and low points.
- Visual Clarity: Each line is rendered as a solid, sea-green horizontal marker. This provides a clear visual map of price action, helping traders identify support, resistance, and key pivot levels at a glance.
- Dynamic Cleanup: To keep your chart organized, the script includes a cleanup mechanism. When the tool is removed or updated, it automatically clears the previous grid lines, ensuring that old data doesn't clutter your workspace.
Key Benefits for Traders
By automating this process, the tool removes the manual labor of drawing levels. It provides a consistent visual framework that helps in identifying potential entry and exit zones based on mathematical intervals, allowing for more disciplined execution and a cleaner overall view of market structure.
/*-----------------------------+
|			       |
| Shared by www.Aptrafx.com    |
|			       |
+------------------------------*/

//+------------------------------------------------------------------+
//|                                      2Extreme4U Grid Builder.mq4 |
//|                     Copyright © 2005, Siddiqi, Alejandro Galindo |
//|                                              http://elCactus.com |
//+------------------------------------------------------------------+
#property copyright "Copyright © 2005, Siddiqi, Alejandro Galindo"
#property link      "http://elCactus.com"

#property indicator_chart_window
extern int GridSpace=50;
//+------------------------------------------------------------------+
//| Custom indicator initialization function                         |
//+------------------------------------------------------------------+
int init()
  {
//---- indicators
//----
   return(0);
  }
//+------------------------------------------------------------------+
//| Custor indicator deinitialization function                       |
//+------------------------------------------------------------------+
int deinit()
  {
//----
   double shift=0;
   double HighPrice=0;
   double LowPrice=0;

   double Divisor = 0.1/Point;

   HighPrice = MathRound(High[Highest(NULL,0,2, Bars - 2,  2)] * Divisor);
   //SL = High[Highest(MODE_HIGH, SLLookback, SLLookback)];
   LowPrice = MathRound(Low[Lowest(NULL,0,1, Bars - 1, 2)] * Divisor);
   for(shift=LowPrice;shift<=HighPrice;shift++)
   {
      ObjectDelete("Grid"+shift);
   }
//----
   return(0);
  }
//+------------------------------------------------------------------+
//| Custom indicator iteration function                              |
//+------------------------------------------------------------------+
int start()
  {
   int    counted_bars=IndicatorCounted();
   double I=0;
   double HighPrice=0;
   double LowPrice=0;
   int GridS=0;
   int SL=0;
//----

   double Divisor = 0.1/Point;

   HighPrice = MathRound(High[Highest(NULL,0,MODE_HIGH, Bars - 2, 2)] * Divisor);
   //SL = High[Highest(MODE_HIGH, SLLookback, SLLookback)];
   LowPrice = MathRound(Low[Lowest(NULL,0,MODE_LOW, Bars - 1, 2)] * Divisor);
   GridS = GridSpace / 10;

   for(I=LowPrice;I<=HighPrice;I++)
   {
	  //Print("mod(I, GridSpace): " + MathMod(I, GridS) + " I= " + I);
	  //Print(LowPrice + " " + HighPrice);
	  if (MathMod(I, GridS) == 0)
	  {
         if (ObjectFind("Grid"+I) != 0)
         {
            ObjectCreate("Grid"+I, OBJ_HLINE, 0, Time[1], I/Divisor);
            ObjectSet("Grid"+I, OBJPROP_STYLE, STYLE_SOLID);
            ObjectSet("Grid"+I, OBJPROP_COLOR, MediumSeaGreen);
         }
		 //MoveObject(I + "Grid", OBJ_HLINE, Time[Bars - 2], I/1000, Time[1], I/1000, MediumSeaGreen, 1, STYLE_SOLID);
	  }
   }
//----
   return(0);
  }
//+------------------------------------------------------------------+
Comments