GannZigZag_001
Download script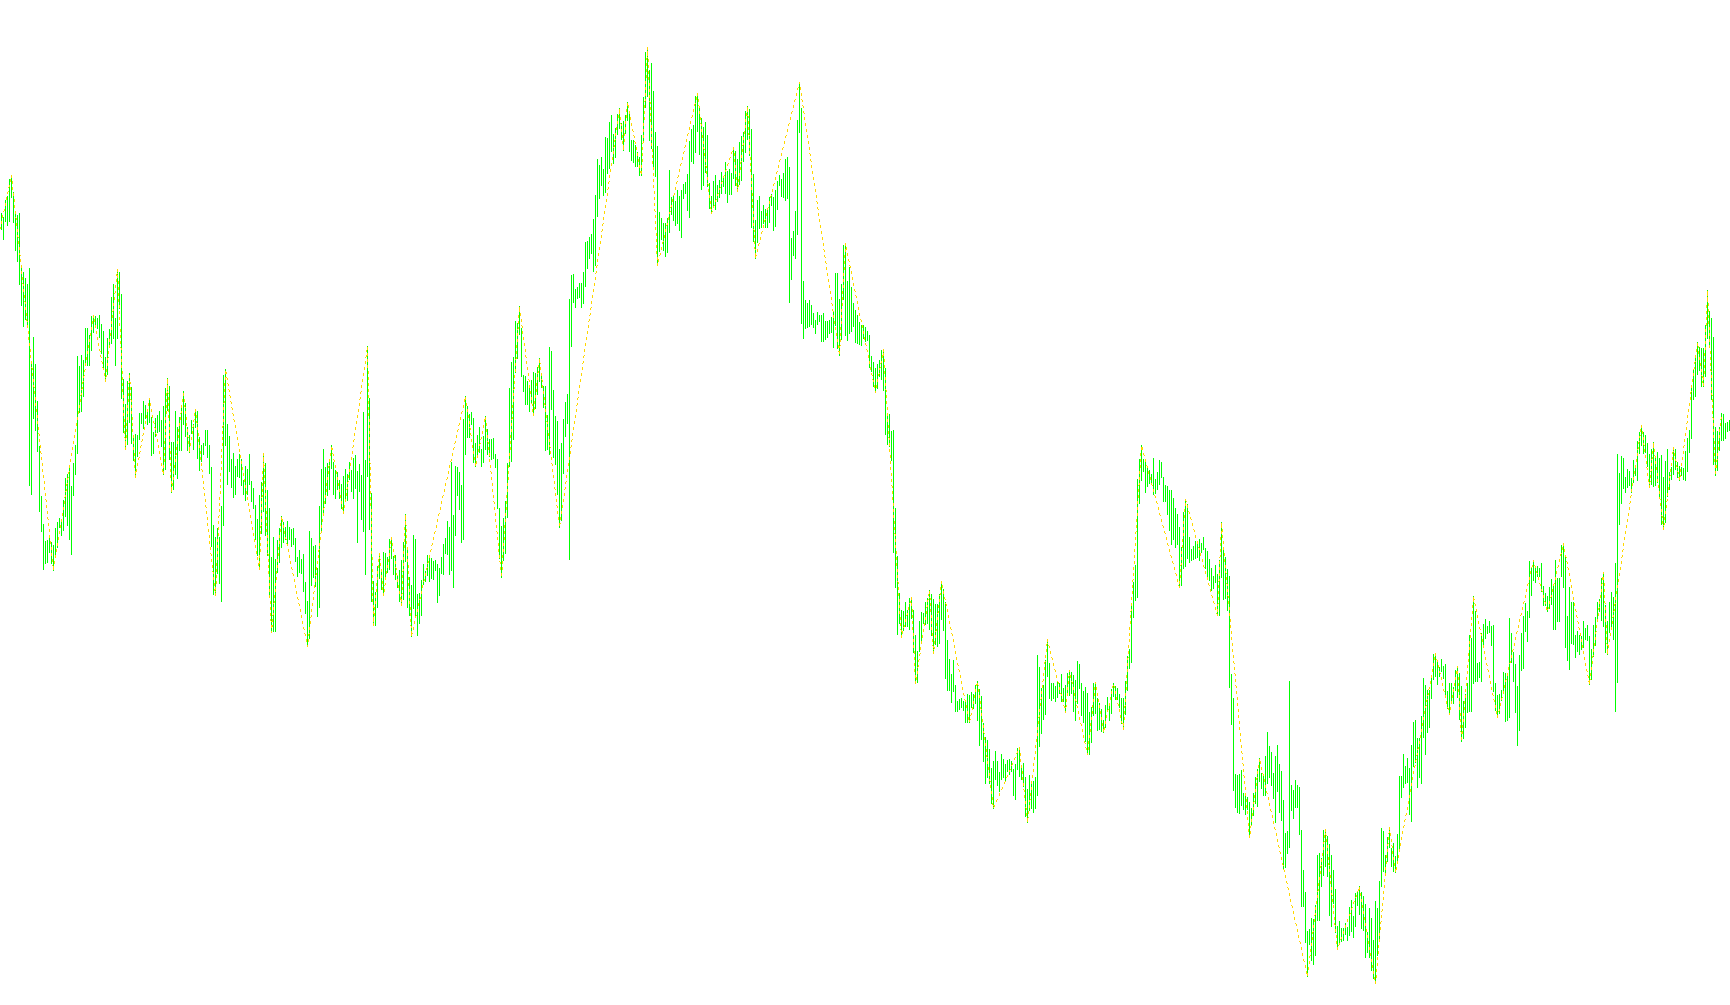
This script is designed to function as a visual charting tool that identifies and maps significant price trends and structural pivot points on a trading platform. It essentially "simplifies" the market noise by identifying core momentum shifts, allowing users to see the primary direction of the price action more clearly.
Core Logic Overview
The indicator works by scanning historical price data to identify extreme highs and lows (peaks and valleys). Instead of simply marking every small movement, it uses a specific logic to determine when a trend has officially changed or stabilized.
1. Trend Tracking and Detection
The script continuously monitors the high and low points of each candle. It keeps track of two primary states: an upward trend and a downward trend. To decide when one trend ends and another begins, it uses a "counter" system (defined by the GSv_range parameter). This ensures that the indicator doesn't react to minor, insignificant price fluctuations but waits for a sustained movement before confirming a new structural point.
2. Identifying Pivot Points (Extremums) The logic looks for specific conditions where the price reaches a new high or a new low:
- Highs: It records new maximums as they occur.
- Lows: It records new minimums as they occur.
- Balance: When the counter for highs and lows reaches a certain threshold, the script recognizes this as a "balance" point or a significant turn in market structure.
3. Dynamic Switching Logic The script contains sophisticated "if-then" rules to handle different market behaviors:
- Simultaneous Extremums: If a single candle manages to hit both a new high and a new low simultaneously (common in highly volatile moments), the script checks the price completion (bullish vs. bearish) to decide which direction the trend line should follow.
- Single Extremum Shifts: If the market only hits a new high without meeting the full counter requirements, the script will update the current high/low markers but remain cautious about officially switching the trend direction until confirmed by further price action.
4. Visual Representation Once the logic determines a significant peak or valley has been reached based on the user's range settings, it "draws" a line or section on the chart. It effectively connects these structural points, creating a zigzag-like path that highlights the backbone of the market movement.
Summary for the User
In plain terms, this tool acts like an automated trend-mapper. You provide it with a sensitivity range, and it handles the heavy lifting of scanning thousands of candles to find the "true" peaks and valleys. It filters out the "jitter" of the market to show you a clean progression of price movement, helping you visualize where the market has shifted from one major level to another.
//+------------------------------------------------------------------+
//|                                                   GannZIGZAG.mq4 |
//|                      Copyright © 2005, MetaQuotes Software Corp. |
//|                                        http://www.metaquotes.net |
//+------------------------------------------------------------------+
#property copyright ""
#property link      ""

#property indicator_chart_window
#property indicator_buffers 2
#property indicator_color1 DeepSkyBlue
#property indicator_color2 Black
//---- input parameters
extern int GSv_range=2;
//---- buffers
double GSv_sl[];
double GSv_m[];
//----
bool draw_up=0,draw_dn=0,initfl=0;
int  fPoint_i,sPoint_i,s_up,s_dn,drawf,lb,idFile;
double h,l;
bool cur_h=0,cur_l=0;
//+------------------------------------------------------------------+
//| Custom indicator initialization function                         |
//+------------------------------------------------------------------+
int init()
  {
//---- indicators
   SetIndexStyle(0,DRAW_SECTION,STYLE_DOT);
   //SetIndexStyle(1,DRAW_SECTION);
   SetIndexBuffer(0,GSv_sl);
   //SetIndexBuffer(1,GSv_m);
   SetIndexEmptyValue(0,0.0);
   //SetIndexEmptyValue(1,0.0);
   FileDelete("Gann.txt");
   idFile=FileOpen("Gann.txt",FILE_READ|FILE_WRITE,"  ");
//----
   return(0);
  }
//+------------------------------------------------------------------+

//+------------------------------------------------------------------+
//| Custom indicator iteration function                              |
//+------------------------------------------------------------------+
int start()
  {
   int counted_bars=IndicatorCounted();
   int cb,limit,i;
//----
   if( GSv_range<1 )
   {
      Alert("Indicator is calculating /n values for GSv_range not less than 1!!!");
      return(-1);
   }
   if( counted_bars<0 )
   {
      return(-1);
   }
   else
   {
      if( Bars-1-counted_bars<=0 )
      {
         limit=0;
      }
      else
      {
         limit=Bars-1-counted_bars;
      }
   }
   //ïåðâîíà÷àëüíàÿ èíèöèàëèçàöèÿ
   if( initfl!=1 )
   {
      myInit();
   }
   //FileWrite(idFile,"  0. Áàðîâ íà ãðàôèêå "+Bars);
   //öèêë ïî áàðàì
   for( cb=limit;cb>=0;cb--)
   {
      if( cb==0 ) FileWrite(idFile,"---- current bar index "+cb+" "+(Bars-1-cb)+" time "+TimeToStr(Time[cb])+" bars on the chart "+Bars);
      //åñëè íà ïðåäûäóùåì áàðå áûë îòðèñîâàí ýêñòðåìóì
      if( GSv_sl[cb+1]>0 && lb!=Bars-1-cb )
      {
         if( draw_up!=0 )
         {
            s_dn=0;
            if( cb==0 ) FileWrite(idFile,"  1. Maximum was drawing, counter for minimums was zeroing");
         }
         else
         {
            if( draw_dn!=0 )
            {
               s_up=0;
               if( cb==0 ) FileWrite(idFile,"  2. Minimum was drawing, counter for maximums was zeroing");
            }
         }
      }
      if( lb!=Bars-1-cb )
      {
         cur_h=0;
         cur_l=0;
         if( cb==0 ) FileWrite(idFile,"  2.1 new bar, flag for maximum/minimum was zeroing");
      }
      if( cb>Bars-2-drawf || (High[cb]<=High[cb+1] && Low[cb]>=Low[cb+1]) )
      {
         if( cb==0 ) FileWrite(idFile,"  3. Either 'inner' bar, or up to the first extremum");
         continue;
      }
      if( draw_up!=0 )
      {
         if( cb==0 ) FileWrite(idFile,"  4. Indicator is in uptrend");
         //åñëè ëèíèÿ íàïðàâëåíà ââåðõ
         if( High[cb]>h )
         {
            //åñëè äîñòèãíóò íîâûé ìàêñèìóì
            h=High[cb];
            cur_h=1;
            if( cb==0 ) FileWrite(idFile,"  5. New maximum was reached = "+h+" cur_h "+cur_h);
         }
         if( Low[cb]<l )
         {
            //åñëè äîñòèãíóò íîâûé ìèíèìóì
            l=Low[cb];
            if( cb==0 ) FileWrite(idFile,"  6. New minimum was reached = "+l);
            //åñëè ýòî íå òîò æå ñàìûé áàð
            if( lb!=Bars-1-cb || cur_l!=1 ) s_dn++;
            cur_l=1;
            if( cb==0 ) FileWrite(idFile,"  7. New bar, counter for minimums was increased "+s_dn+" cur_l "+cur_l);
         }
         //åñëè ñ÷åò÷èêè ðàâíû
         if( s_up==s_dn )
         {
            if( cb==0 ) FileWrite(idFile,"  8. counters are equal");
            //åñëè ïîñëåäíèé áàð îäíîâðåìåííî íîâûé ìàêñèìóì è ìèíèìóì
            if( cur_h==cur_l && cur_l==1 )
            {
               if( cb==0 ) FileWrite(idFile,"  9. There are 2 extremums");
               //åñëè ñâå÷à ìåäâåæüÿ
               if( Close[cb]<=Open[cb] )
               {
                  draw_up=0;
                  draw_dn=1;
                  fPoint_i=sPoint_i;
                  sPoint_i=Bars-1-cb;
                  GSv_sl[cb]=l;
                  for( i=cb+1;i<Bars-1-fPoint_i;i++ )
                  {
                     GSv_sl[i]=0;
                  }
                  if( cb==0 ) FileWrite(idFile,"  10.Bearish candle, line up = "+draw_up+", line down,"+draw_dn+" fPoint_i = "+fPoint_i+" sPoint_i "+sPoint_i+" indicator = "+GSv_sl[cb]);
               }
               else
               {
                  //åñëè ñâå÷à áû÷üÿ
                  sPoint_i=Bars-1-cb;
                  GSv_sl[cb]=h;
                  for( i=cb+1;i<Bars-1-fPoint_i;i++ )
                  {
                     GSv_sl[i]=0;
                  }
                  if( cb==0 ) FileWrite(idFile,"  11. Bullish candle, line up = "+draw_up+", line down,"+draw_dn+" fPoint_i = "+fPoint_i+" sPoint_i "+sPoint_i+" indicator = "+GSv_sl[cb]);
               }
            }
            else
            {
               //åñëè ïîñëåäíèé áàð òîëüêî íîâûé ìàêñèìóì
               if( cur_h==1 )
               {
                  sPoint_i=Bars-1-cb;
                  GSv_sl[cb]=h;
                  l=Low[cb];
                  for( i=cb+1;i<Bars-1-fPoint_i;i++ )
                  {
                     GSv_sl[i]=0;
                  }
                  if( cb==0 ) FileWrite(idFile,"  12. Maximum only, indicator = "+GSv_sl[cb]+" sPoint_i "+sPoint_i+" l "+l);
               }
               else
               {
                  if( cur_l==1 )
                  {
                     //åñëè ïîñëåäíèé áàð òîëüêî íîâûé ìèíèìóì
                     draw_up=0;
                     draw_dn=1;
                     fPoint_i=sPoint_i;
                     sPoint_i=Bars-1-cb;
                     GSv_sl[cb]=l;
                     h=High[cb];
                     for( i=cb+1;i<Bars-1-fPoint_i;i++ )
                     {
                        GSv_sl[i]=0;
                     }
                     if( cb==0 ) FileWrite(idFile,"  13. Minimum only, indicator = "+GSv_sl[cb]+" fPoint_i "+fPoint_i+" sPoint_i "+sPoint_i+" draw_up "+draw_up+" draw_dn "+draw_dn+" h "+h);
                  }
               }
            }
         }
         else
         {
            //èíà÷å åñëè ñìåíû íàïðàâëåíèÿ íåò ÿâíî (ñ÷åò÷èê Dn ñâå÷åé íå ðàâåí GSv_range)
            if( cb==0 ) FileWrite(idFile,"  14. counters are not equal");
            //åñëè äîñòèãíóò íîâûé ìàêñèìóì
            if( cur_h==1 )
            {
               sPoint_i=Bars-1-cb;
               GSv_sl[cb]=h;
               for( i=cb+1;i<Bars-1-fPoint_i;i++ )
               {
                  GSv_sl[i]=0;
               }
               l=Low[cb];
               if( cb==0 ) FileWrite(idFile,"  15. New maximum, indicator "+GSv_sl[cb]+" sPoint_i "+sPoint_i+" l "+l);
            }
         }
      }
      else
      {
         //åñëè ëèíèÿ íàïðàâëåíà âíèç
         if( cb==0 ) FileWrite(idFile,"  16. Indicator is on downtrend");
         if( High[cb]>h )
         {
            //åñëè äîñòèãíóò íîâûé ìàêñèìóì
            h=High[cb];
            if( cb==0 ) FileWrite(idFile,"  17. New maximum was riched "+h);
            if( lb!=Bars-1-cb || cur_h!=1 ) s_up++;
            cur_h=1;
            //åñëè ýòî íå òîò æå ñàìûé áàð
            if( cb==0 ) FileWrite(idFile,"  18. New bar, counter for maximums was increased "+s_up+" cur_h "+cur_h+" h "+h);
         }
         if( Low[cb]<l )
         {
            //åñëè äîñòèãíóò íîâûé ìèíèìóì
            l=Low[cb];
            cur_l=1;
            if( cb==0 ) FileWrite(idFile,"  19. New minimum was riched "+l+" cur_l "+cur_l);
         }
         //åñëè ñ÷åò÷èêè ðàâíû
         if( s_up==s_dn )
         {
            if( cb==0 ) FileWrite(idFile,"  20. counters are equal");
            //åñëè ïîñëåäíèé áàð îäíîâðåìåííî íîâûé ìàêñèìóì è ìèíèìóì
            if( cur_h==cur_l && cur_l==1 )
            {
               if( cb==0 ) FileWrite(idFile,"  21. There are 2 extremums");
               //åñëè ñâå÷à ìåäâåæüÿ
               if( Close[cb]<=Open[cb] )
               {
                  sPoint_i=Bars-1-cb;
                  GSv_sl[cb]=l;
                  for( i=cb+1;i<Bars-1-fPoint_i;i++ )
                  {
                     GSv_sl[i]=0;
                  }
                  if( cb==0 ) FileWrite(idFile,"  22. Bearish candle, indicator "+GSv_sl[cb]+" sPoint_i "+sPoint_i);
               }
               else
               {
                  //åñëè ñâå÷à áû÷üÿ
                  draw_up=1;
                  draw_dn=0;
                  fPoint_i=sPoint_i;
                  sPoint_i=Bars-1-cb;
                  GSv_sl[cb]=h;
                  for( i=cb+1;i<Bars-1-fPoint_i;i++ )
                  {
                     GSv_sl[i]=0;
                  }
                  if( cb==0 ) FileWrite(idFile,"  23. Bullish candle, indicator "+GSv_sl[cb]+" draw_up "+draw_up+" draw_dn "+draw_dn+" sPoint_i "+sPoint_i+" fPoint_i "+fPoint_i);
               }
            }
            else
            {
               //åñëè ïîñëåäíèé áàð òîëüêî íîâûé ìàêñèìóì
               if( cur_h==1 )
               {
                  draw_up=1;
                  draw_dn=0;
                  fPoint_i=sPoint_i;
                  sPoint_i=Bars-1-cb;
                  GSv_sl[cb]=h;
                  l=Low[cb];
                  for( i=cb+1;i<Bars-1-fPoint_i;i++ )
                  {
                     GSv_sl[i]=0;
                  }
                  if( cb==0 ) FileWrite(idFile,"  24. Maximum only, indicator "+GSv_sl[cb]+" draw_up "+draw_up+" draw_dn "+draw_dn+" sPoint_i "+sPoint_i+" fPoint_i "+fPoint_i+" l "+l);
               }
               else
               {
                  if( cur_l==1 )
                  {
                     //åñëè ïîñëåäíèé áàð òîëüêî íîâûé ìèíèìóì
                     sPoint_i=Bars-1-cb;
                     GSv_sl[cb]=l;
                     h=High[cb];
                     for( i=cb+1;i<Bars-1-fPoint_i;i++ )
                     {
                        GSv_sl[i]=0;
                     }
                     if( cb==0 ) FileWrite(idFile,"  25. Minimum only, indicator "+GSv_sl[cb]+" sPoint_i "+sPoint_i+" h "+h);
                  }
               }
            }
         }
         else
         {
            //èíà÷å åñëè ñìåíû íàïðàâëåíèÿ íåò ÿâíî (ñ÷åò÷èê Up ñâå÷åé íå ðàâåí GSv_range)
            if( cb==0 ) FileWrite(idFile,"  26. Counters are not equal");
            //åñëè äîñòèãíóò íîâûé ìèíèìóì
            if( cur_l==1 )
            {
               sPoint_i=Bars-1-cb;
               GSv_sl[cb]=l;
               for( i=cb+1;i<Bars-1-fPoint_i;i++ )
               {
                  GSv_sl[i]=0;
               }
               h=High[cb];
               if( cb==0 ) FileWrite(idFile,"  27. New minimum was riched, indicator "+GSv_sl[cb]+" sPoint_i "+sPoint_i+" h "+h);
            }
         }
      }
      if( lb!=Bars-1-cb ) lb=Bars-1-cb;
   }

//----
   return(0);
  }
//+------------------------------------------------------------------+

//+------------------------------------------------------------------+
//| Custor indicator deinitialization function                       |
//+------------------------------------------------------------------+
int deinit()
  {
//----
   FileClose(idFile);
//----
   return(0);
  }
//+------------------------------------------------------------------+

//+------------------------------------------------------------------+
// Ôóíêöèÿ íà÷àëüíîé èíèöèàëèçàöèè èíäèêàòîðà                        |
//+------------------------------------------------------------------+
void myInit()
  {
//----
   int cb;
   fPoint_i=0;
   h=High[Bars-1];
   l=Low[Bars-1];
   for( cb=Bars-2;cb>=0;cb--)
   {
      if( High[cb]>High[cb+1] || Low[cb]<Low[cb+1] )
      {
         if( High[cb]>h && High[cb]>High[cb+1] )
         {
            s_up++;
         }
         if( Low[cb]<l && Low[cb]<Low[cb+1] )
         {
            s_dn++;
         }
      }
      else
      {
         continue;
      }
      if( s_up==s_dn && s_up==GSv_range )
      {
         h=High[cb];
         l=Low[cb];
         sPoint_i=Bars-1-cb;
         if( Close[cb]>=Open[cb] )
         {
            s_dn=0;
            GSv_sl[Bars-1]=Low[Bars-1];
            GSv_sl[cb]=High[cb];
            draw_up=1;
            break;
         }
         else
         {
            s_up=0;
            GSv_sl[Bars-1]=High[Bars-1];
            GSv_sl[cb]=Low[cb];
            draw_dn=1;
            break;
         }
      }
      else
      {
         h=High[cb];
         l=Low[cb];
         sPoint_i=Bars-1-cb;
         if( s_up==GSv_range )
         {
            s_dn=0;
            GSv_sl[Bars-1]=Low[Bars-1];
            GSv_sl[cb]=High[cb];
            draw_up=1;
            break;
         }
         else
         {
            if( s_dn==GSv_range )
            {
               s_up=0;
               GSv_sl[Bars-1]=High[Bars-1];
               GSv_sl[cb]=Low[cb];
               draw_dn=1;
               break;
            }
         }
      }
   }
   initfl=1;
   drawf=sPoint_i;
//----
   return(0);
  }
//+------------------------------------------------------------------+
Comments