DECEMA_v1
Download script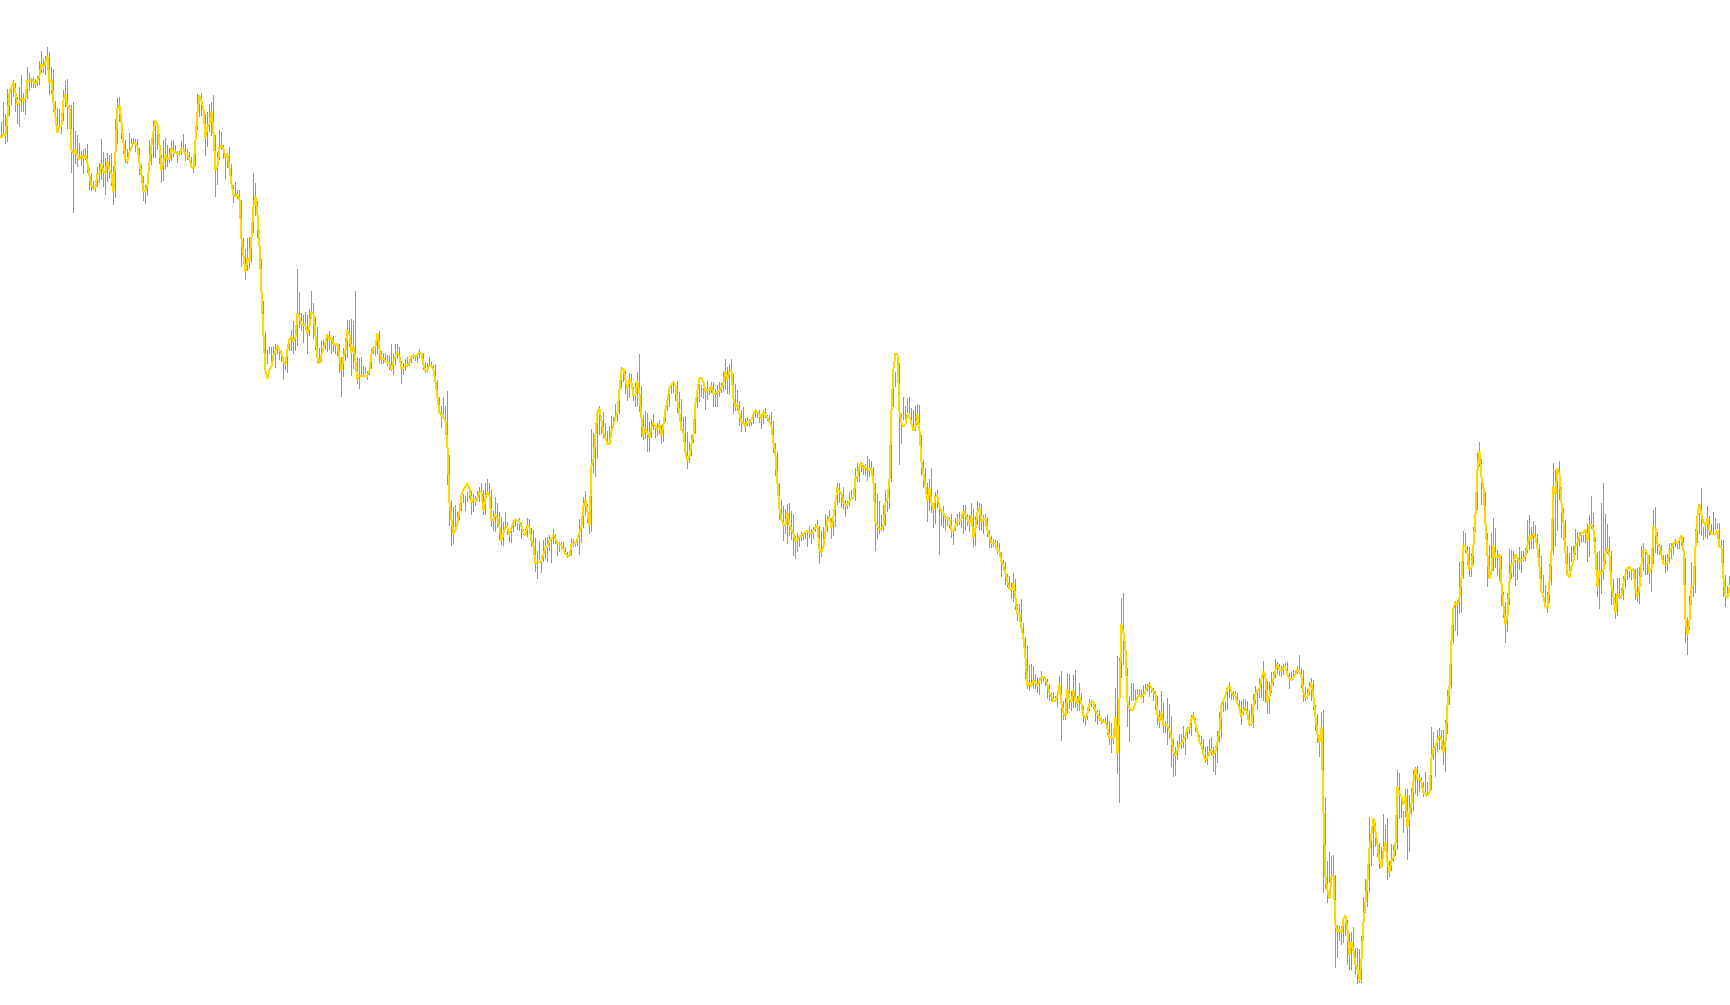
The DECEMA indicator is a sophisticated technical analysis tool designed to smooth out market noise and identify underlying price trends. Unlike standard moving averages that simply calculate the average price over a set period, this script employs a multi-layered mathematical approach to produce a more refined and responsive visual output.
Core Logic and Methodology
1. The Smoothing Foundation The indicator begins by establishing a base calculation using a weighted smoothing factor (alpha). This factor is determined by your chosen period setting, ensuring that the tool balances responsiveness to new price actions with stability against minor market fluctuations.
2. Multi-Stage Recursive Processing Instead of calculating a single moving average, the script processes the data through ten distinct sequential layers. Each layer takes the result of the previous one and applies the smoothing algorithm again. This "chaining" effect effectively filters out high-frequency "jitter" from the price chart, creating a much smoother curve that highlights long-term momentum rather than short-term distractions.
3. Advanced Weighted Calculation The final output is not a simple average of these ten layers. Instead, the script applies a complex weighted formula to the results. By assigning specific multipliers and subtracting certain layers from others, the logic emphasizes the most significant trend data while suppressing "noise." This specific mathematical weighting is designed to produce a line that follows the price action closely enough to be relevant, but smoothly enough to prevent false signals caused by erratic price spikes.
4. Real-Time Data Handling The script includes internal safeguards to ensure data integrity as new candles form. It tracks time coordinates to maintain consistency between historical calculations and live market updates. This ensures that the indicator remains stable and provides a continuous, unbroken line even as the market moves in real-time.
Summary of Visual Behavior
When applied to a chart, the resulting red line represents a highly processed "filtered" view of the price. Because of the ten-layer recursive logic and the final weighted calculation, the indicator is built to reveal the dominant direction of the market, providing a cleaner visual representation of trend flow compared to standard moving average tools.
//Version: 1
//Time: December 03, 2006
//+------------------------------------------------------------------+
//|                              DECEMA                              |
//|                                                       DECEMA.mq4 |
//|                                         Developed by Coders Guru |
//|                                            http://www.xpworx.com |
//|
//|                         Revised by IgorAD,igorad2003@yahoo.co.uk |
//|                                        http://www.forex-tsd.com/ |
//+------------------------------------------------------------------+
//+------------------------------------------------------------------+

#property link      "http://www.xpworx.com"


#property indicator_chart_window
#property indicator_buffers 1
#property indicator_color1 Red


extern   int      MA_Period                  = 15;
extern   int      MA_Price                   = PRICE_CLOSE;

double DrawEMA[];

double EMA1, EMA2, EMA3, EMA4, EMA5, EMA6, EMA7, EMA8, EMA9, EMA10;
int time2;
double bEMA1, bEMA2, bEMA3, bEMA4, bEMA5, bEMA6, bEMA7, bEMA8, bEMA9, bEMA10;
double alfa;

int init()
{
   SetIndexStyle(0,DRAW_LINE, STYLE_SOLID,2);
   SetIndexBuffer(0,DrawEMA);
   string short_name="DECEMA("+MA_Period+")";
   IndicatorShortName(short_name);
   SetIndexDrawBegin(0,10*MA_Period);

   alfa = 2.0/(1.0+MA_Period);

   return(0);
}
int deinit()
{
   return(0);
}


void start()
{

   int limit,MaxBar;
   int counted_bars=IndicatorCounted();

   if(Bars-1 < MA_Period)return(0);

   if (counted_bars<0) return(-1);
   if (counted_bars>0) counted_bars--;

   MaxBar=Bars-1-MA_Period;
   limit =Bars-counted_bars-1;

   if (limit>MaxBar)
   {
      for (int shift=limit;shift>=MaxBar;shift--)
      DrawEMA[Bars-shift]=0.0;

   limit=MaxBar;
   }

   int Tnew=Time[limit+1];

   if (limit<MaxBar)

      if (Tnew==time2)
      {
      EMA1=bEMA1;
      EMA2=bEMA2;
      EMA3=bEMA3;
      EMA4=bEMA4;
      EMA5=bEMA5;
      EMA6=bEMA6;
      EMA7=bEMA7;
      EMA8=bEMA8;
      EMA9=bEMA9;
      EMA10=bEMA10;
      }
      else
      {
      if (Tnew>time2)Print("Error1");
      else Print("Error2");
      return(-1);
      }

   for(shift=limit; shift>=0; shift--)
   {
   if(shift == 1)
      if(((limit == 1)&&(time2 != Time[2])) || (limit > 1))
      {
      time2 = Time[2];
      bEMA1=EMA1;
      bEMA2=EMA2;
      bEMA3=EMA3;
      bEMA4=EMA4;
      bEMA5=EMA5;
      bEMA6=EMA6;
      bEMA7=EMA7;
      bEMA8=EMA8;
      bEMA9=EMA9;
      bEMA10=EMA10;
      }

   EMA1 = alfa*iMA(NULL,0,1,0,MODE_SMA,MA_Price,shift) + (1-alfa)*EMA1;
   EMA2 = alfa*EMA1 + (1-alfa)*EMA2;
   EMA3 = alfa*EMA2 + (1-alfa)*EMA3;
   EMA4 = alfa*EMA3 + (1-alfa)*EMA4;
   EMA5 = alfa*EMA4 + (1-alfa)*EMA5;
   EMA6 = alfa*EMA5 + (1-alfa)*EMA6;
   EMA7 = alfa*EMA6 + (1-alfa)*EMA7;
   EMA8 = alfa*EMA7 + (1-alfa)*EMA8;
   EMA9 = alfa*EMA8 + (1-alfa)*EMA9;
   EMA10= alfa*EMA9 + (1-alfa)*EMA10;

   DrawEMA[shift] = 10*EMA1-45*EMA2+120*EMA3-210*EMA4+252*EMA5-210*EMA6+120*EMA7-45*EMA8+10*EMA9-EMA10;
   }
   return(0);
}
Comments