DeltaAlert_001
Download script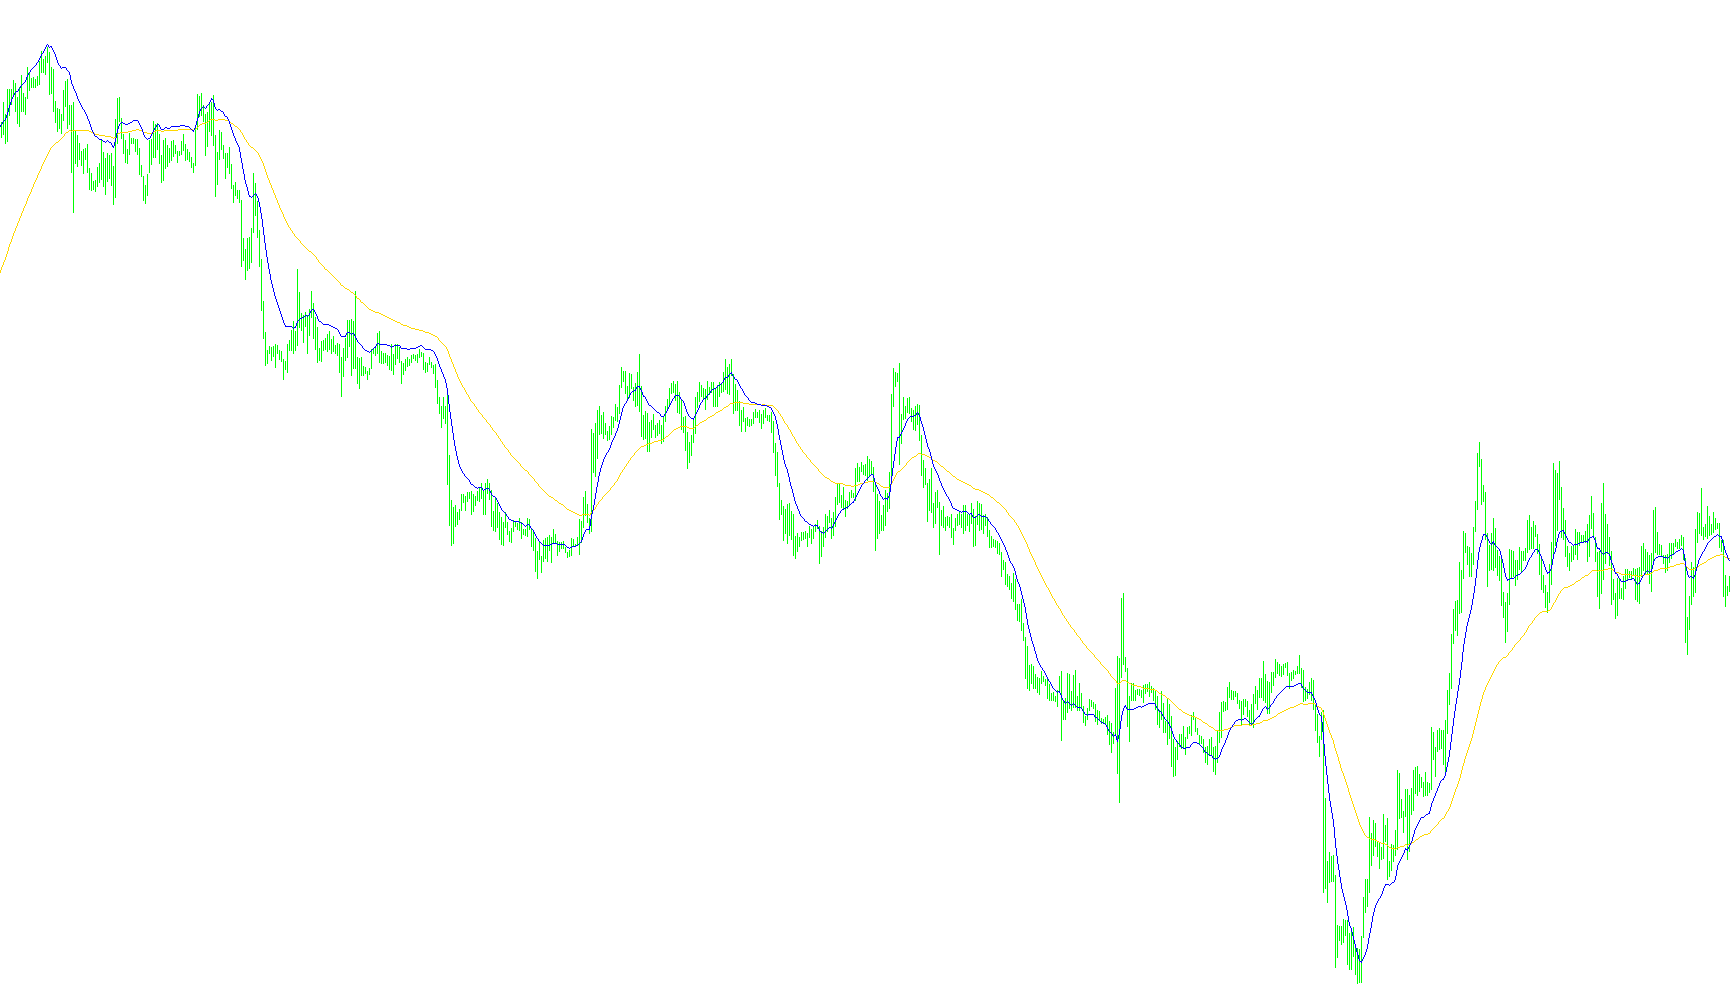
This tool is designed to help traders identify potential momentum shifts and price trends by measuring the "distance" between current market prices and two different moving averages. Instead of just looking at whether a trend is going up or down, it focuses on how far the price has drifted from its historical averages.
How the Logic Works
1. Dual Moving Average Tracking The script monitors two distinct Exponential Moving Averages (EMAs). These represent two different time horizons:
- A Slow Period: Used to identify the broader, long-term trend of the market.
- A Fast Period: Used to capture more immediate, short-term price movements.
2. Calculating the "Delta" (Price Deviation) The core intelligence of this script lies in its calculation of "deltas." For both the slow and fast periods, the tool calculates the numerical difference between the moving average value and the current closing price.
- By converting these differences into specific points, the tool creates two visual lines.
- These lines represent how much "stretch" or "pullback" exists in the market relative to its average price at any given moment.
3. Signal Generation The script compares these two deviations against each other to determine when a trend change is occurring:
- Buy Signals: When the deviation of the fast period becomes greater than the deviation of the slow period, it indicates a specific type of momentum shift. If this happens for the first time in a sequence, the tool triggers an alert.
- Sell Signals: Conversely, when the deviation of the slow period exceeds that of the fast period (or the fast period drops below the slow), it suggests a reversal or cooling off of momentum. The script identifies this "crossover" in logic and issues a corresponding alert.
4. User Experience & Alerts To ensure traders don't have to watch the screen constantly, the script is equipped with a notification system. When the specific conditions for a Buy or Sell signal are met on the most recent candle, the tool generates a pop-up alert. This notification includes essential trading data such as:
- The current Ask and Bid prices.
- The exact Date and Time of the signal.
- The Currency Symbol and Timeframe being analyzed.
Summary for Traders
Essentially, this tool acts as a "tension meter." It measures how much the price is pulling away from its historical averages across two different speeds. When those tensions shift in relation to one another, the script interprets it as a signal that the market may be changing direction, notifying you immediately so you can evaluate your next move.
//+------------------------------------------------------------------+
//|                                                        SmWPR.mq4 |
//|                      Copyright © 2006, MetaQuotes Software Corp. |
//|                                        http://www.metaquotes.net |
//+------------------------------------------------------------------+
#property copyright "Copyright © 2006, MetaQuotes Software Corp."
#property link      "http://www.metaquotes.net"

#property indicator_separate_window
#property indicator_buffers 2
#property indicator_color1 Blue
#property indicator_color2 Red
//---- input parameters

extern int       sper=60;
extern int       fper=13;
extern int       test=0;
extern int       nBars=100;
extern bool      AlertON=true;

//---- buffers
double ExtMapBuffer1[];
double ExtMapBuffer2[];
double shift, sdel, fdel, mas, maf, mBar;

int flagval1 = 0;
int flagval2 = 0;

//+------------------------------------------------------------------+
//| Custom indicator initialization function                         |
//+------------------------------------------------------------------+
int init()
  {
//---- indicators
   SetIndexStyle(0,DRAW_LINE);
   SetIndexBuffer(0,ExtMapBuffer1);
   SetIndexLabel(0,"sdel");
   SetIndexStyle(1,DRAW_LINE);
   SetIndexBuffer(1,ExtMapBuffer2);
   SetIndexLabel(1,"fdel");
//----
   return(0);
  }
//+------------------------------------------------------------------+
//| Custom indicator iteration function                              |
//+------------------------------------------------------------------+
int start()
  {

      for(int shift=Bars-1; shift>0; shift--)
      {
         ExtMapBuffer1[shift]=0;
         ExtMapBuffer2[shift]=0;
      }

      if (test==1) {mBar=nBars;} else {mBar=Bars;}

      for(shift=Bars-1; shift>0; shift--)
      {
         mas=iMA(NULL, 0, sper, 0, MODE_EMA, PRICE_CLOSE,shift-1);
         maf=iMA(NULL, 0, fper, 0, MODE_EMA, PRICE_CLOSE,shift-1);
         sdel=MathRound((mas-Close[0])/Point);
         fdel=MathRound((maf-Close[0])/Point);
         if (sdel==0) {sdel=0.0001;}
         if (fdel==0) {fdel=0.0001;}
         if (sdel!=0) {ExtMapBuffer1[shift-1]=sdel;}
         if (fdel!=0) {ExtMapBuffer2[shift-1]=fdel;}

        if (fdel > sdel)
        {
         if (flagval1==0)
         {
           flagval1=1;
           flagval2=0;
           if (shift == 1 && AlertON ) Alert("BUY signal at Ask=",Ask,"\n Bid=",Bid,"\n Time=",TimeToStr(CurTime(),TIME_DATE)," ",TimeHour(CurTime()),":",TimeMinute(CurTime()),"\n Symbol=",Symbol()," Period=",Period());
         }

        }
        else if (fdel < sdel)
        {
         if ( flagval2==0)
         {
          flagval2=1;
          flagval1=0;
          if (shift == 1 && AlertON) Alert("SELL signal at Ask=",Ask,"\n Bid=",Bid,"\n Date=",TimeToStr(CurTime(),TIME_DATE)," ",TimeHour(CurTime()),":",TimeMinute(CurTime()),"\n Symbol=",Symbol()," Period=",Period());
         }

        }
      }

   return(0);
  }
//+------------------------------------------------------------------+
Comments