Delta_v1
Download script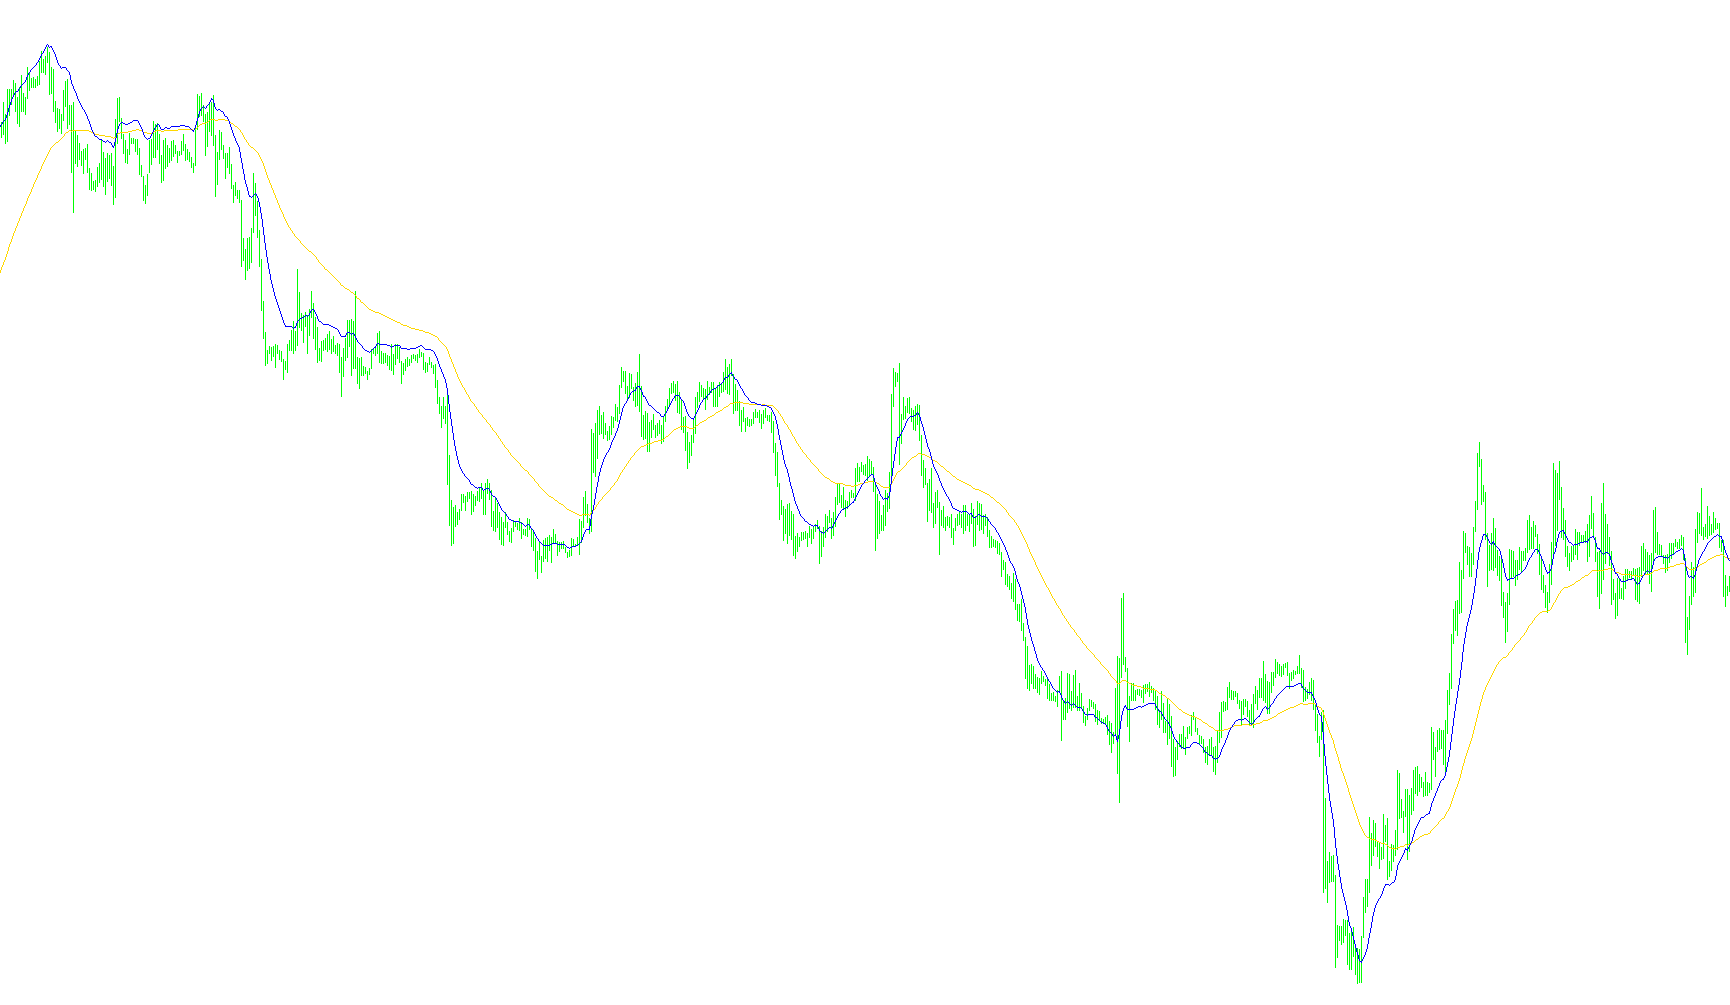
This script is designed as a visual trading tool that tracks the mathematical relationship between current market prices and two distinct moving averages. Instead of showing the price movement directly on your main chart, it creates a separate window to help you visualize "distance" or "deviation."
Core Logic and Behavior
The indicator functions by calculating two different types of Exponential Moving Averages (EMAs). One is based on a long-term period (the "slow" average), and the other is based on a short-term period (the "fast" average).
Rather than plotting these averages as lines, the script measures the specific gap between the current market price and each of these two averages. This distance is converted into a numerical value that represents how far the market has stretched away from its mean.
Key Features
- Dual-Line Visualization: The tool generates two separate lines in a dedicated sub-window. One line represents the deviation of the long-term average, and the other represents the short-term average.
- Dynamic Scaling: The script identifies how many price points (pips/points) the market is currently "overextended" or "underextended" relative to these averages.
- Customizable Sensitivity: Users can adjust the timeframe of both the fast and slow averages, as well as choose between analyzing a specific number of historical bars or the entire available chart history.
- Zero-Point Safety: To ensure the lines remain visible and accurate even when the price is touching an average exactly, the script includes a small adjustment to prevent the data from flatlining at zero.
Practical Use
By looking at this indicator, a trader can quickly see if the market is "overstretched." When the lines in the sub-window move significantly away from the center, it suggests that the price is moving aggressively in one direction compared to its historical average. When the lines return toward the center, it indicates that the price is stabilizing back toward its mean.
//+------------------------------------------------------------------+
//|                                                        SmWPR.mq4 |
//|                      Copyright © 2006, MetaQuotes Software Corp. |
//|                                        http://www.metaquotes.net |
//+------------------------------------------------------------------+
#property copyright "Copyright © 2006, MetaQuotes Software Corp."
#property link      "http://www.metaquotes.net"
//----
#property indicator_separate_window
#property indicator_buffers 2
#property indicator_color1 Blue
#property indicator_color2 Red
//---- input parameters
extern int       sper=60;
extern int       fper=13;
extern int       test=0;
extern int       nBars=100;
//---- buffers
double ExtMapBuffer1[];
double ExtMapBuffer2[];
double shift, sdel, fdel, mas, maf, mBar;
//+------------------------------------------------------------------+
//| Custom indicator initialization function                         |
//+------------------------------------------------------------------+
int init()
  {
//---- indicators
   SetIndexStyle(0,DRAW_LINE);
   SetIndexBuffer(0,ExtMapBuffer1);
   SetIndexStyle(1,DRAW_LINE);
   SetIndexBuffer(1,ExtMapBuffer2);
//----
   return(0);
  }
//+------------------------------------------------------------------+
//| Custom indicator iteration function                              |
//+------------------------------------------------------------------+
int start()
  {
   for(int shift=Bars-1; shift>0; shift--)
     {
      ExtMapBuffer1[shift]=0;
      ExtMapBuffer2[shift]=0;
     }
   if (test==1) {mBar=nBars;} else {mBar=Bars;}
   for(shift=Bars-1; shift>0; shift--)
     {
      mas=iMA(NULL, 0, sper, 0, MODE_EMA, PRICE_CLOSE,shift-1);
      maf=iMA(NULL, 0, fper, 0, MODE_EMA, PRICE_CLOSE,shift-1);
      sdel=MathRound((mas-Close[0])/Point);
      fdel=MathRound((maf-Close[0])/Point);
      if (sdel==0) {sdel=0.0001;}
      if (fdel==0) {fdel=0.0001;}
      if (sdel!=0) {ExtMapBuffer1[shift-1]=sdel;}
      if (fdel!=0) {ExtMapBuffer2[shift-1]=fdel;}
     }
//----
   return(0);
  }
//+------------------------------------------------------------------+
Comments