DECEMA_v2
Download script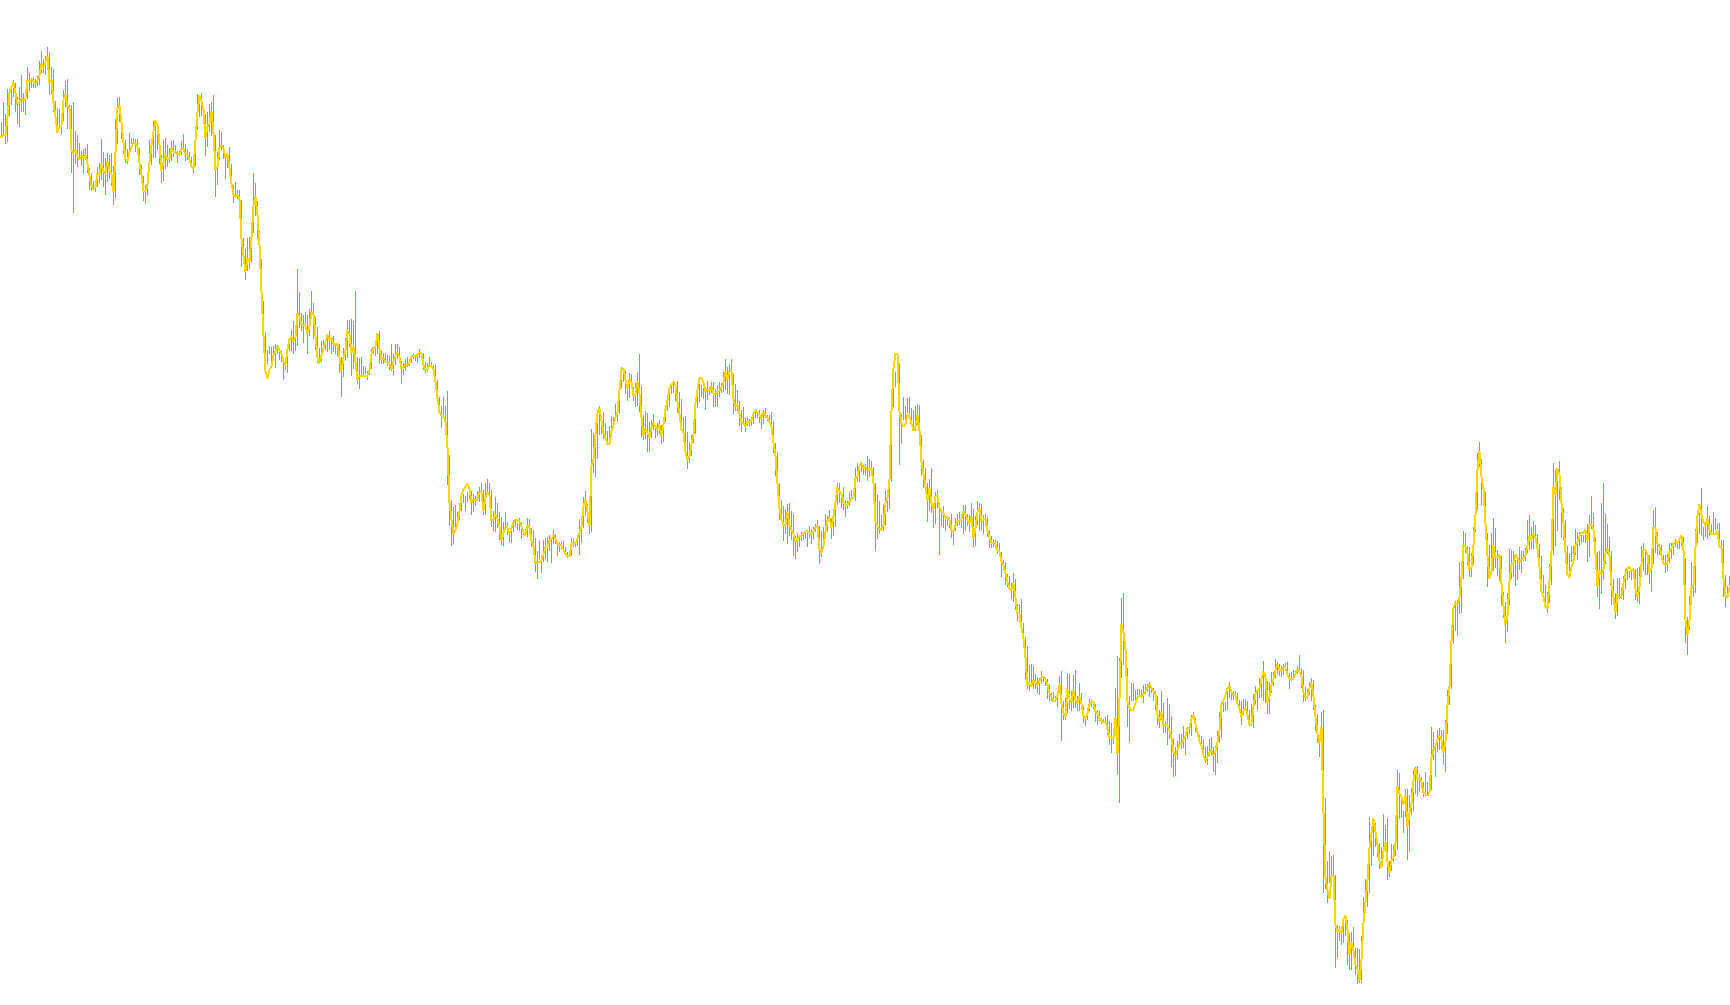
The DECEMA indicator is a specialized technical analysis tool designed to smooth out market volatility and highlight underlying price trends. It operates by layering multiple mathematical filters on top of existing data to provide a cleaner visual representation of market movement.
How the Logic Works
The core logic of this script relies on a multi-stage processing system. Rather than looking at the raw price alone, the indicator performs the following steps:
1. Data Foundation The script begins by pulling data from a primary source (specifically the "DECEMA-a" component). This serves as the "raw material" for the rest of the calculations. It takes specific parameters, such as moving average periods and price types, to establish a baseline.
2. The Smoothing Chain (Nested Filtering) The indicator then subjects that initial data to a rigorous smoothing process. It creates a chain of four successive Exponential Moving Averages (EMA). Each new level is calculated based on the previous one:
- Level 1 is smoothed from the raw data.
- Level 2 is smoothed from Level 1.
- Level 3 is smoothed from Level 2.
- Level 4 is smoothed from Level 3.
By doing this, the script effectively "filters out" minor market noise and fluctuations, leaving behind a more stable path of the price action.
3. The Weighted Synthesis The final step—and the most unique part of the logic—is the mathematical weighting of these layers. Instead of simply adding them together, the script applies specific coefficients (multipliers) to different levels of the smoothing chain.
Specifically, it combines the primary data source with four weighted versions of the smoothed layers. By using both positive and negative weights, the indicator creates a balanced, synthesized line that reacts dynamically to price changes while maintaining a smooth trajectory.
Summary for the User
In simple terms, DECEMA acts like a high-quality lens for your charts. It takes messy, jagged market data, passes it through several layers of smoothing filters, and then blends them together using a specific mathematical formula. The result is a visual trend line that helps traders identify the "true" direction of the market by ignoring temporary distractions and price spikes.
/*-----------------------------+
|			       |
| Shared by www.Aptrafx.com    |
|			       |
+------------------------------*/

//Version: 1
//Time: December 03, 2006
//+------------------------------------------------------------------+
//|                              DECEMA                              |
//|                                                       DECEMA.mq4 |
//|                                         Developed by Coders Guru |
//|                                            http://www.xpworx.com |
//+------------------------------------------------------------------+

//+------------------------------------------------------------------+
//|                     NOTE: DECEMA-a is required                   |
//+------------------------------------------------------------------+

#property link      "http://www.xpworx.com"


#property indicator_chart_window
#property indicator_buffers 1
#property indicator_color1 Red


extern   int      MA_Period                  = 15;
extern   int      MA_Price                   = PRICE_CLOSE;

double DrawBuffer[];
double StoreBuffer[];
double StoreBuffer2[];
double Buffer7[];
double Buffer8[];
double Buffer9[];
double Buffer10[];

int init()
{
   IndicatorBuffers(7);

   SetIndexStyle(0,DRAW_LINE, STYLE_SOLID,2);
   SetIndexBuffer(0,DrawBuffer);
   SetIndexBuffer(1,StoreBuffer);
   SetIndexBuffer(2,StoreBuffer2);
   SetIndexBuffer(3,Buffer7);
   SetIndexBuffer(4,Buffer8);
   SetIndexBuffer(5,Buffer9);
   SetIndexBuffer(6,Buffer10);

   return(0);
}
int deinit()
{
   return(0);
}


void start()
{

   int limit;

   int counted_bars=IndicatorCounted();
   if(counted_bars<0) return(-1);
   limit=Bars-counted_bars-1;


   for(int shift=0; shift<limit; shift++)
       StoreBuffer[shift] = iCustom(NULL,0,"DECEMA-a",MA_Period,MA_Price,1,shift);

   for(shift=0; shift<limit; shift++)
       Buffer7[shift] = iMAOnArray(StoreBuffer,0,MA_Period,0,MODE_EMA,shift);

   for(shift=0; shift<limit; shift++)
       Buffer8[shift] = iMAOnArray(Buffer7,0,MA_Period,0,MODE_EMA,shift);

   for(shift=0; shift<limit; shift++)
       Buffer9[shift] = iMAOnArray(Buffer8,0,MA_Period,0,MODE_EMA,shift);

   for(shift=0; shift<limit; shift++)
       Buffer10[shift] = iMAOnArray(Buffer9,0,MA_Period,0,MODE_EMA,shift);

   for(shift=0; shift<limit; shift++)
       StoreBuffer2[shift] = iCustom(NULL,0,"DECEMA-a",MA_Period,MA_Price,0,shift);

   //DECEMA:= (10*EMA1)-(45*EMA2)+(120*EMA3)-(210*EMA4)+(252*EMA5)-(210*EMA6)+(120*EMA7)-(45*EMA8)+(10*EMA9)-EMA10;
   for(shift=0; shift<limit; shift++)
       DrawBuffer[shift] = StoreBuffer2[shift] + (120*Buffer7[shift])-(45*Buffer8[shift])+(10*Buffer9[shift])- Buffer10[shift];

   return(0);
}
Comments