DayOpenFib
Download script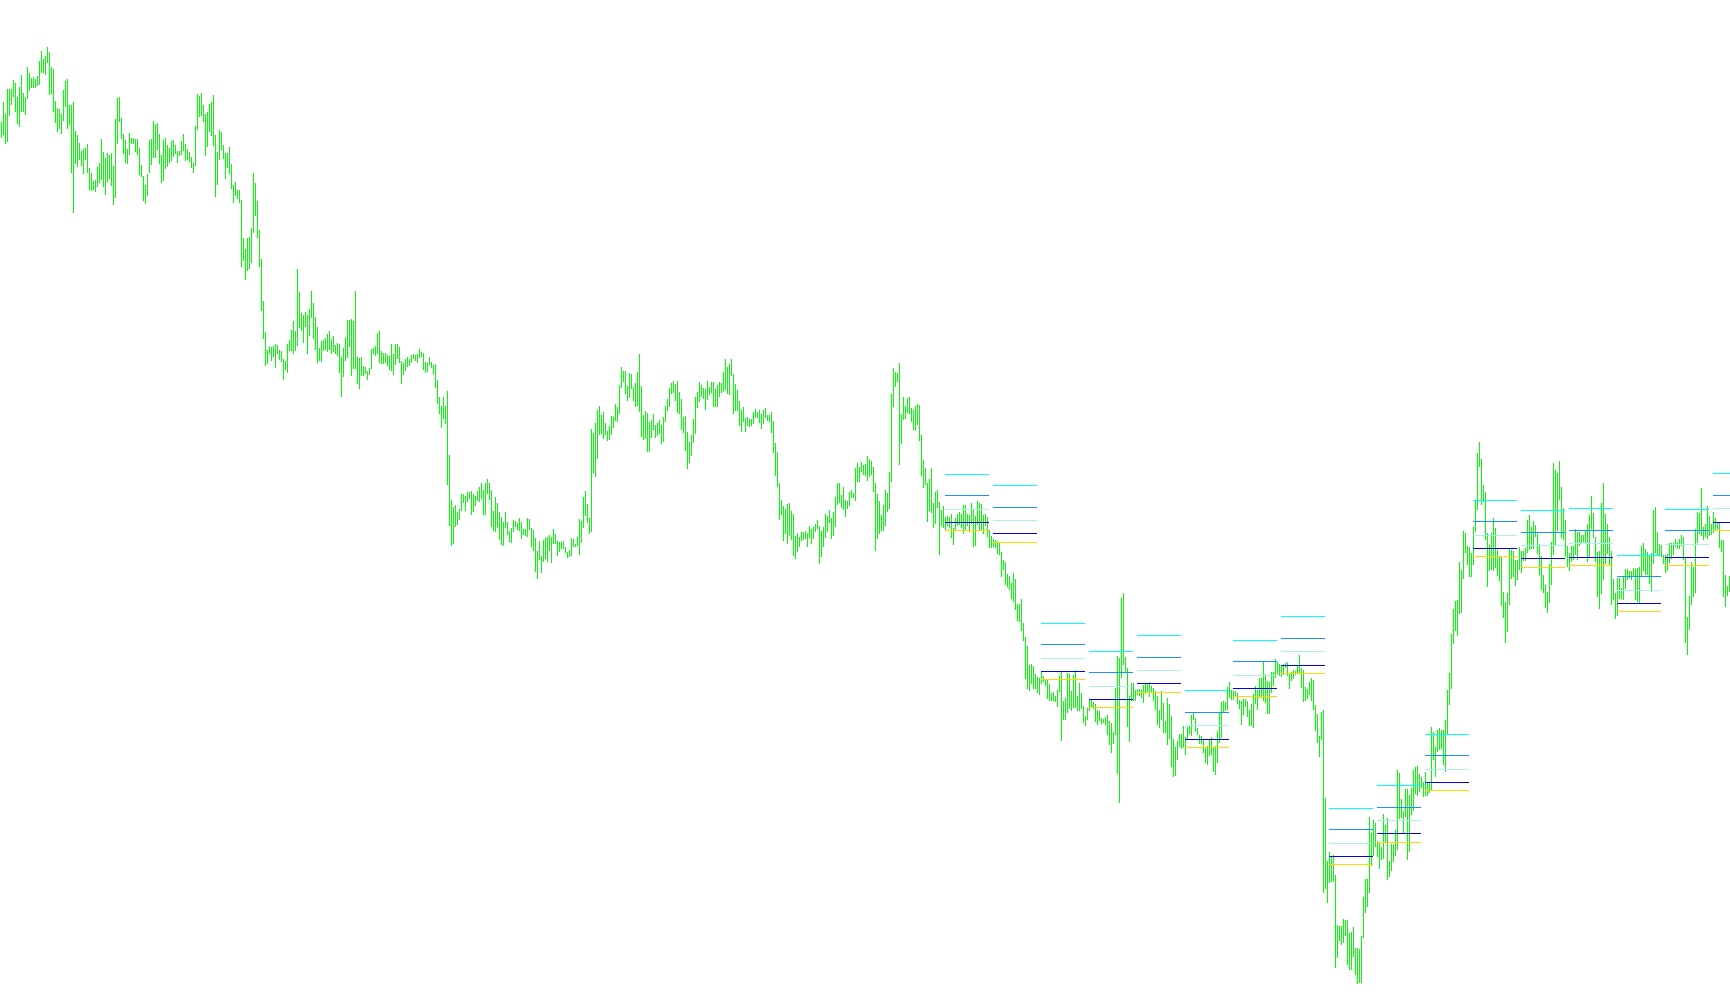
This tool is designed to provide traders with a clear visual layout of key price levels based on the opening price of previous daily candles. By automatically identifying where each day began, it projects specific mathematical markers onto your current chart, helping you identify potential areas of support or resistance.
How the Logic Works
The script operates by looking back at historical daily data to establish a baseline for current price action. Here is a breakdown of the core logic:
1. Historical Data Retrieval The tool scans back through a user-defined number of days (defaulting to 100). It specifically looks for the "Opening Price" of each day on a daily timeframe, regardless of which smaller timeframe (like 1-minute or 5-minute charts) you are currently viewing.
2. Dynamic Level Projection For every day identified in the history, the script calculates four distinct price lines based on the opening price. The calculation follows a specific direction set by the user:
- Upward Trend: If the "up" setting is enabled, the tool projects levels above the daily opening price.
- Downward Trend: If the "up" setting is disabled, it projects levels below the daily opening price.
3. Mathematical Offsets The script applies four specific numerical increments (34, 89, 144, and 233) to the daily opening price. In technical analysis, these numbers are often associated with Fibonacci-style proportions. By applying these fixed offsets to the daily open, the tool creates a structured "grid" that allows you to see where significant price reactions might occur relative to that day's start.
4. Visual Continuity The indicator is designed to map these levels across your chart history. It ensures that as time progresses, the lines accurately represent the opening price of the correct historical days, allowing you to visualize how price has interacted with these specific "Day Open" levels over a long period.
Summary for Traders
Instead of manually calculating where a day started and trying to guess where key price levels might be, this script automates that process. It draws a horizontal map of significant price zones based on the daily open, allowing you to see at a glance whether the current market price is sitting near a historically significant "Day Open" level or one of its projected mathematical offsets.
//+------------------------------------------------------------------+
//|                                                  DayOpenFib.mq4 |
//|                                                                  |
//|                                                                  |
//+------------------------------------------------------------------+
#property copyright ""
#property link      ""

#property indicator_chart_window
//+------------------------------------------------------------------+
//| Custom indicator initialization function                         |
//+------------------------------------------------------------------+
#property indicator_buffers 6
#property indicator_color1 Red
#property indicator_color2 Green
#property indicator_color3 Green
#property indicator_color4 Green
#property indicator_color5 Green
#property indicator_color6 Green


double yc[];
double l1[]; //38
double l2[]; //89
double l3[]; //144
double l4[]; //233
//double l5[]; //233

extern int  HowManyDays = 100;
extern bool up=true;

int init()
  {
//---- indicators
//----
   SetIndexBuffer(0, yc);
   SetIndexStyle(0, DRAW_LINE, STYLE_SOLID);
   SetIndexLabel(0, "Yesterday Close");
   SetIndexBuffer(1, l1);
   SetIndexStyle(1, DRAW_LINE);
   SetIndexLabel(1, "Line 1");
   SetIndexBuffer(2, l2);
   SetIndexStyle(2, DRAW_LINE);
   SetIndexLabel(2, "Line 2");
   SetIndexBuffer(3, l3);
   SetIndexStyle(3, DRAW_LINE);
   SetIndexLabel(3, "Line 3");
   SetIndexBuffer(4, l4);
   SetIndexStyle(4, DRAW_LINE);
   SetIndexLabel(4, "Line 4");
   //SetIndexBuffer(5, l5);
   //SetIndexStyle(5, DRAW_LINE);
   //SetIndexLabel(5, "Line 5");

   return(0);
  }
//+------------------------------------------------------------------+
//| Custom indicator deinitialization function                       |
//+------------------------------------------------------------------+
int deinit()
  {
//----

//----
   return(0);
  }
//+------------------------------------------------------------------+
//| Custom indicator iteration function                              |
//+------------------------------------------------------------------+
int start()
  {
   int limit;
   int i=0,j=0;
   int counted_bars=IndicatorCounted();
//---- check for possible errors
   if(counted_bars<0) return(-1);
//---- last counted bar will be recounted
   if(counted_bars>0) counted_bars--;
   limit=Bars-counted_bars;
//----
   datetime dailyTime[];
   double dailyClose[],dailyOpen[];
   bool newEndDay=false;

   ArrayCopySeries(dailyTime,MODE_TIME,Symbol(),PERIOD_D1);
   ArrayCopySeries(dailyOpen,MODE_OPEN,Symbol(),PERIOD_D1);


   for (i=0;i<limit;i++){
      if ( j < HowManyDays && Period() < PERIOD_D1){
         if (newEndDay) {newEndDay=false; continue;}
         yc[i] = dailyOpen[j];
         if (up) {
            l1[i] = dailyOpen[j] + 34*Point;
            l2[i] = dailyOpen[j] + 89*Point;
            l3[i] = dailyOpen[j] + 144*Point;
            l4[i] = dailyOpen[j] + 233*Point;
         }else{
            l1[i] = dailyOpen[j] - 34*Point;
            l2[i] = dailyOpen[j] - 89*Point;
            l3[i] = dailyOpen[j] - 144*Point;
            l4[i] = dailyOpen[j] - 233*Point;

         }

         if (Time[i+1] < dailyTime[j]) {
            j++;

            newEndDay=true;
         }

      }


   }

//----
   return(0);
  }
//+------------------------------------------------------------------+
Comments