Complex_pairs1
Download script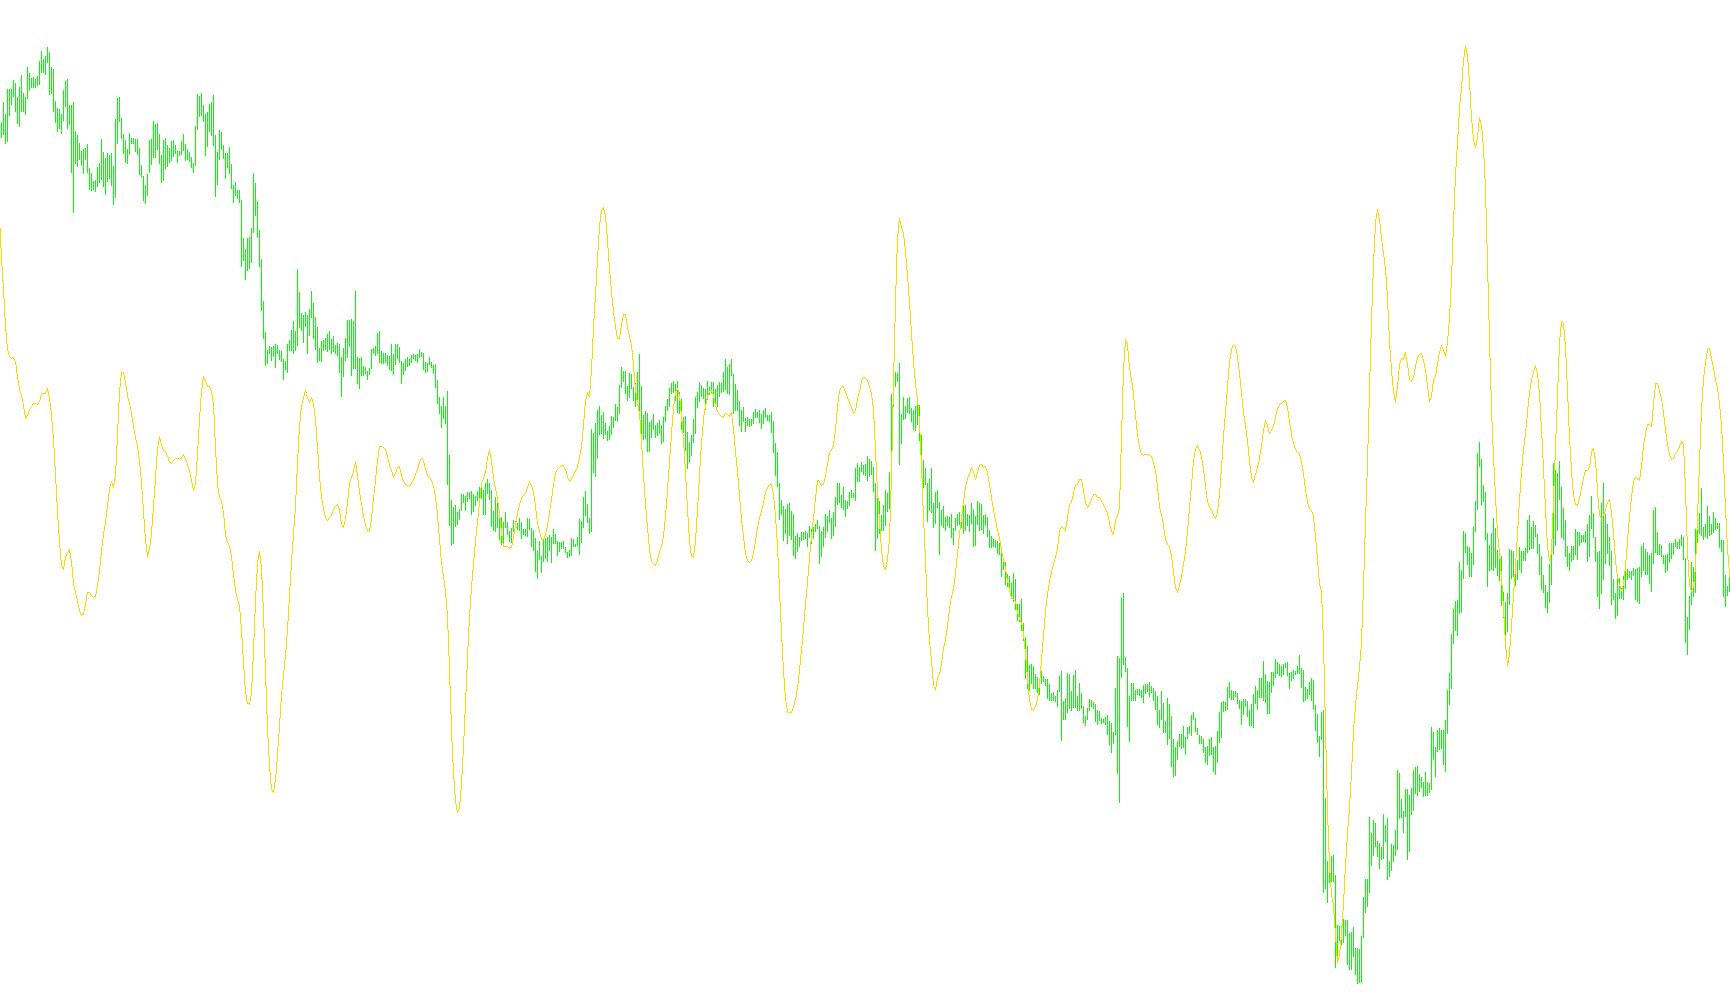
This custom trading indicator is designed to provide a smoothed visual representation of price momentum by calculating the difference between two distinct moving averages. Instead of showing you just one line of data, it focuses on the "spread" or the gap between short-term and long-term price trends across various timeframes.
How the Logic Works
1. Dynamic Timeframe Adaptation The script is intelligent enough to recognize which chart period you are currently viewing (e.g., 1-minute, Hourly, Daily, or Monthly). It contains a pre-defined set of "speed" settings for every possible timeframe. For example, on a 1-minute chart, it uses a specific pair of calculation lengths, while on a Monthly chart, it switches to a different set. This ensures that the indicator remains relevant and balanced regardless of whether you are day trading or swing trading.
2. The Dual Moving Average Comparison The core logic relies on calculating two different types of averages simultaneously:
- A Fast Average: This tracks the recent price movement closely, reacting quickly to sudden market changes.
- A Slow Average: This tracks the broader trend over a longer duration, filtering out minor "noise."
The indicator calculates the numerical distance between these two averages at every point on the chart. By subtracting the slow average from the fast average (or vice versa depending on the setting), it isolates the current momentum of the market.
3. Data Aggregation (Price Averaging) To ensure the calculation is as accurate as possible, the script doesn't just look at the "Closing" price of a candle. It takes four key data points—the Open, High, Low, and Close prices—and calculates their average. This provides a more holistic view of the price action within each period.
4. Visual Output The result is plotted as a single line on a separate window below your main chart.
- When the line moves significantly in one direction, it indicates that the short-term price is pulling away from the long-term trend.
- When the line is near zero or flat, it suggests that the short-term and long-term prices are in equilibrium.
Summary for the User
Think of this indicator as a "momentum gauge." It strips away the complexity of the raw price candles and shows you the relationship between fast-moving trends and slow-moving trends. By automatically adjusting its sensitivity based on your chosen timeframe, it provides a consistent way to visualize whether the market is accelerating or stabilizing.
//+------------------------------------------------------------------+

//+------------------------------------------------------------------+

#property indicator_separate_window
#property indicator_buffers 1
#property indicator_color1 Green
//---- buffers
double pair[];
//---- parameters
// for monthly
int mn_per = 12;
int mn_fast = 3;
// for weekly
int w_per = 9;
int w_fast = 3;
// for daily
int d_per = 5;
int d_fast = 3;
// for H4
int h4_per = 12;
int h4_fast = 2;
// for H1
int h1_per = 24;
int h1_fast = 8;
// for M30
int m30_per = 16;
int m30_fast = 2;
// for M15
int m15_per = 16;
int m15_fast = 4;
// for M5
int m5_per = 12;
int m5_fast = 3;
// for M1
int m1_per = 30;
int m1_fast = 10;

//+------------------------------------------------------------------+
//| Custom indicator initialization function                         |
//+------------------------------------------------------------------+
int init()
  {
//---- indicators
   SetIndexStyle(0,DRAW_LINE);
   SetIndexBuffer(0,pair);
   IndicatorShortName(Symbol() + "(" + Period() + "): ");
   SetIndexLabel(0, Symbol());
//----
   return(0);
  }
//+------------------------------------------------------------------+
//| Custom indicator deinitialization function                       |
//+------------------------------------------------------------------+
int deinit()
  {
//----

//----
   return(0);
  }
//+------------------------------------------------------------------+
//| Custom indicator iteration function                              |
//+------------------------------------------------------------------+
int start()
  {
     int limit;
     int counted_bars=IndicatorCounted();
     double OPEN,HIGH,LOW,CLOSE;
  //---- ïðîâåðêà íà âîçìîæíûå îøèáêè
     if(counted_bars<0) return(-1);
  //---- ïîñëåäíèé ïîñ÷èòàííûé áàð áóäåò ïåðåñ÷èòàí
     if(counted_bars>0) counted_bars-=10;
     limit=Bars-counted_bars;
  //---- îñíîâíîé öèêë
     int Price=6;
     int Mode=3;
     int per1,per2;
      switch(Period())
        {
         case 1:     per1 = m1_per; per2 = m1_fast; break;
         case 5:     per1 = m5_per; per2 = m5_fast; break;
         case 15:    per1 = m15_per;per2 = m15_fast; break;
         case 30:    per1 = m30_per;per2 = m30_fast; break;
         case 60:    per1 = h1_per; per2 = h1_fast; break;
         case 240:   per1 = h4_per; per2 = h4_fast; break;
         case 1440:  per1 = d_per;  per2 = d_fast; break;
         case 10080: per1 = w_per;  per2 = w_fast; break;
         case 43200: per1 = mn_per; per2 = mn_fast; break;
        }
     for(int i=0; i<limit; i++)
       {
               OPEN=pp(Mode,PRICE_OPEN,i,per1,per2);
               HIGH=pp(Mode,PRICE_HIGH,i,per1,per2);
               LOW=pp(Mode,PRICE_LOW,i,per1,per2);
               CLOSE=pp(Mode,PRICE_CLOSE,i,per1,per2);
        pair[i]=(OPEN+HIGH+LOW+CLOSE)/4;
       }

//----
   return(0);
  }

//+------------------------------------------------------------------+

double pp(int Mode, int Price, int i, int per1, int per2){
   return(
            (iMA(Symbol(),0,per2,0,Mode,Price,i)-
            iMA(Symbol(),0,per1,0,Mode,Price,i)));
}
Comments