Cool2_v1
Download script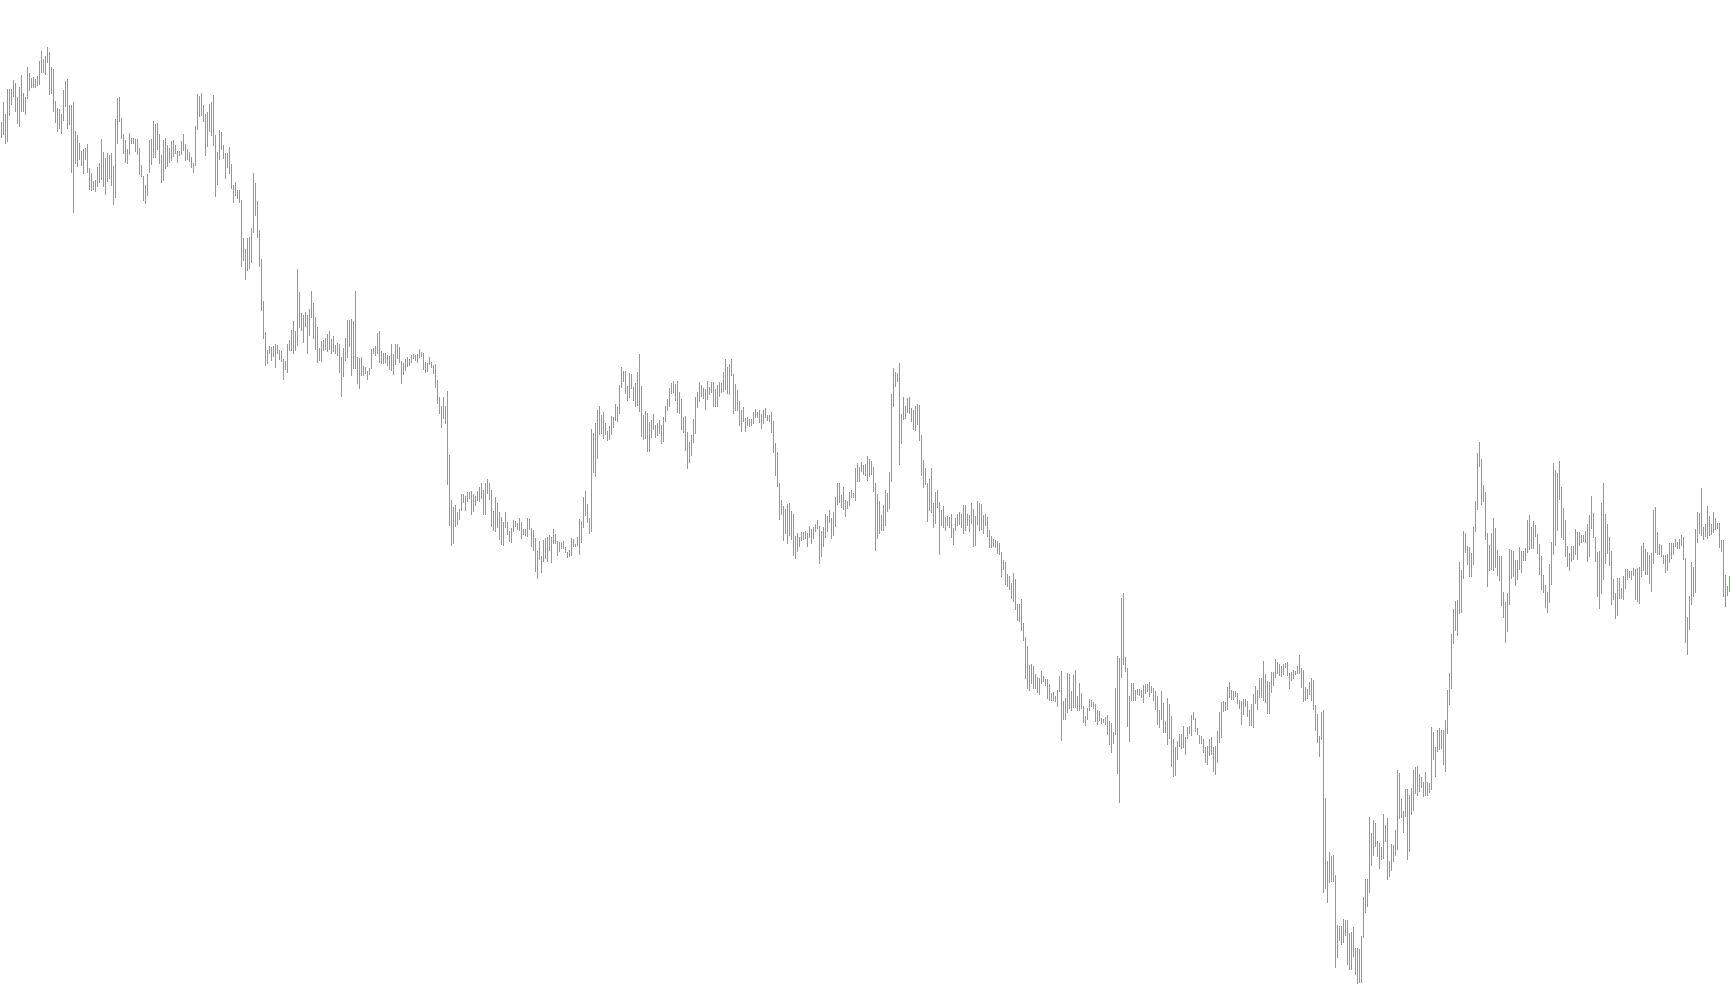
This script functions as a custom technical analysis tool designed to visualize specific price relationships on a trading chart. Rather than simply showing raw price movements, it calculates a modified trend line based on the interaction between standard price data and moving averages.
Core Logic and Methodology
The logic operates by analyzing a rolling window of recent price history (defined by the user as 300 bars) and applying a weighted mathematical transformation to identify "deviations." Here is how the process works:
1. Weighted Data Collection The script looks back at a specific number of previous candles (defaulting to 5). For each of these candles, it captures two primary types of information:
- Midpoint Prices: It calculates the average between the high and low points of each candle.
- Smoothed Averages: It retrieves a "Smoothed Moving Average" (SMMA), which represents a balanced trend over a short period.
2. Weighted Distribution (The Calculation) Instead of treating every candle in that 5-period window equally, the script applies a weighted distribution logic. It gives different levels of importance to each candle based on its position relative to the current price. This creates a specialized "weighted average" for both the raw price data and the moving average data simultaneously.
3. Deviation Analysis The tool then calculates the difference between these two weighted averages. By comparing the weighted midpoint price against the weighted smoothed average, it determines how much the current market behavior is "stretching" away from its expected trend.
4. Final Output Generation The final line you see on your chart is generated by taking the actual closing price of the candle and adjusting it based on a logarithmic scale of the deviation calculated above.
Summary of Purpose
In simple terms, this script isn't just drawing a trend; it is calculating a relative momentum shift. By comparing a weighted historical midpoint to a weighted moving average, it identifies whether the current price is moving in a way that significantly deviates from the recent smoothed trend. The resulting line on your chart represents the actual price "corrected" by this specific mathematical deviation.
//+------------------------------------------------------------------+
//|                                                        Cool2.mq4 |
//|                                        Ramdass - Conversion only |
//+------------------------------------------------------------------+

#property indicator_chart_window
#property indicator_buffers 1
#property indicator_color1 Red
//----
extern int ndot = 5;
extern int CountBars = 300;
//---- buffers
double cfl[];
//+------------------------------------------------------------------+
//| Custom indicator initialization function                         |
//+------------------------------------------------------------------+
int init()
  {
   string short_name;
//---- indicator line
   IndicatorBuffers(1);
   SetIndexStyle(0, DRAW_LINE);
   SetIndexBuffer(0, cfl);
//----
   if(CountBars >= Bars)
       CountBars = Bars;
   SetIndexDrawBegin(0, Bars - CountBars + ndot + 1);
//----
   return(0);
  }
//+------------------------------------------------------------------+
//| Cool2                                                              |
//+------------------------------------------------------------------+
int start()
  {
   int i, shift, cnt, ndot1, counted_bars = IndicatorCounted();
   double TYVar, ZYVar, TIndicatorVar, ZIndicatorVar, M, N, AY, AIndicator;
//----
   if(Bars <= ndot)
       return(0);
//----
   shift = CountBars - ndot - 1;
//----
   while(shift >= 0)
     {
       TYVar = 0;
	      ZYVar = 0;
	      N = 0;
	      M = 0;
	      TIndicatorVar = 0;
	      ZIndicatorVar = 0;
	      ndot1 = ndot;
	      if(shift + 1 < ndot1)
	          ndot1 = shift + 1;
	      for(cnt = ndot; cnt >= 1; cnt--) // n=5 -  ïî ïÿòè òî÷êàì
	        {
		         N = N + cnt*cnt;  //ðàâíî 55
		         M = M + cnt;      //ðàâíî 15
	        }
	      for(cnt = ndot1; cnt >= 1; cnt--) // n=5 -  ïî ïÿòè òî÷êàì
	        {
		         ZYVar = ZYVar + (High[shift-cnt+1] + Low[shift-cnt+1]) / 2*(ndot+1-cnt);
		         TYVar = TYVar + (High[shift-cnt+1] + Low[shift-cnt+1]) / 2;
		         ZIndicatorVar = ZIndicatorVar + iMA(NULL, 0, 5, 3, MODE_SMMA, PRICE_MEDIAN,
		                                             shift - cnt + 1)*(ndot + 1 - cnt);
		         TIndicatorVar = TIndicatorVar + iMA(NULL, 0, 5, 3, MODE_SMMA, PRICE_MEDIAN,
		                                             shift - cnt + 1);
	         }
	      AY = (TYVar + (N - 2*ZYVar)*ndot / M) / M;
	      AIndicator = (TIndicatorVar + (N - 2*ZIndicatorVar)*ndot / M) / M;
	      cfl[shift] = Close[shift] + ((-1000)*MathLog(AY / AIndicator) / 500);
	      shift--;
     }
   return(0);
  }
//+------------------------------------------------------------------+
Comments