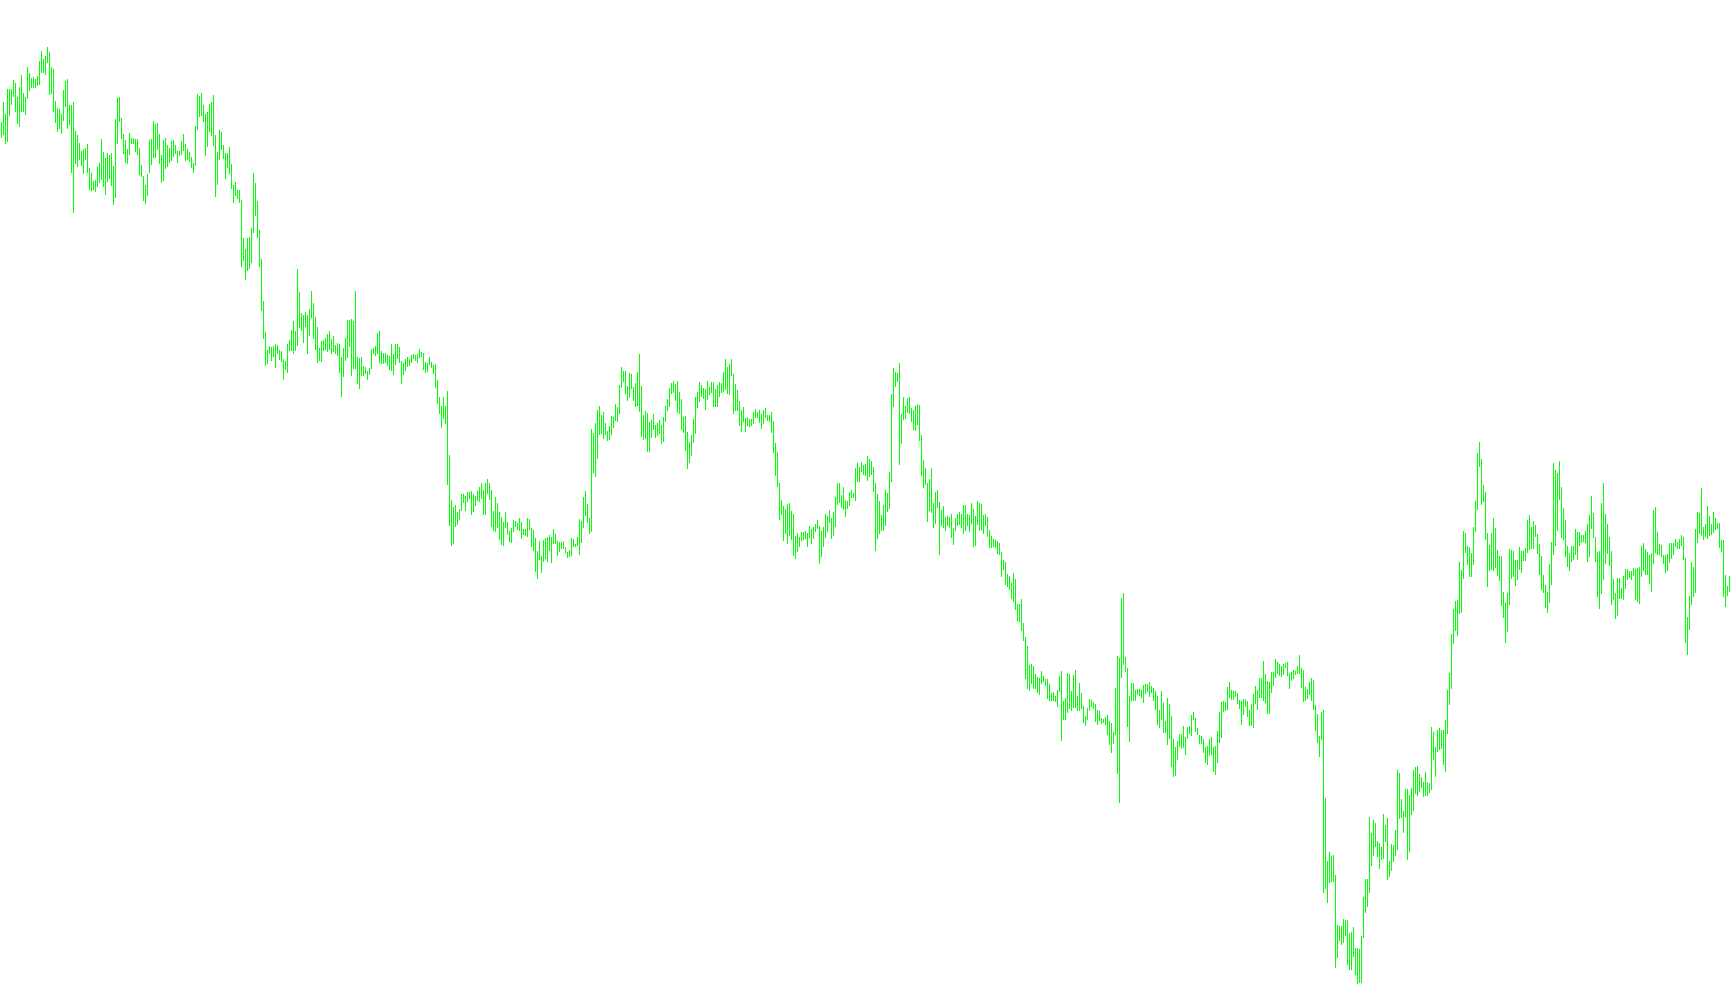
//+------------------------------------------------------------------+
//|                                                  Correlation.mq4 |
//|                                               Áåçáîðîäîâ Àëåêñåé |
//|                                                   AlexeiBv@ya.ru |
//+------------------------------------------------------------------+
#property copyright "Áåçáîðîäîâ Àëåêñåé"
#property link      "AlexeiBv@ya.ru"
//----
#property indicator_separate_window
#property indicator_buffers 1
#property indicator_color1 Silver
//----
extern string OtherChart="EURUSD";
extern int n=20;
extern bool UseOpen=true;
extern bool UseClose=false;
extern bool UseHigh=false;
extern bool UseLow=false;
extern int CalcBars=400;
//----
double Buffer[];
//+------------------------------------------------------------------+
//| Custom indicator initialization function                         |
//+------------------------------------------------------------------+
int init()
  {
//---- indicators
   string short_name;
//---- 1 additional buffer used for counting.
   IndicatorBuffers(1);
   IndicatorDigits(Digits);
//---- indicator line
   SetIndexStyle(0,DRAW_HISTOGRAM);
   SetIndexBuffer(0,Buffer);
   //  SetIndexBuffer(1,TempBuffer);
//---- name for DataWindow and indicator subwindow label
   short_name="Correlation("+n+")";
   IndicatorShortName(short_name);
   SetIndexLabel(0,short_name);
//----
   return(0);
  }
//+------------------------------------------------------------------+
//| Custom indicator deinitialization function                       |
//+------------------------------------------------------------------+
int deinit()
  {
//----
//----
   return(0);
  }
//+------------------------------------------------------------------+
//| Custom indicator iteration function                              |
//+------------------------------------------------------------------+
int start()
  {
   // Print("True "+true+" false "+false  );
   int i,k,counted_bars=IndicatorCounted();
   double sx,sy,x,y,cor1,cor2,cor3;
//----
   if(Bars<=n) return(0);
//----
   int limit=Bars-counted_bars;
   if(counted_bars>0) limit++;
   for(i=0; i<CalcBars; i++)
     {
      sx=0; sy=0;
      for(k=0; k<n; k++)
        {
         if((UseOpen+UseClose+UseHigh+UseLow)==0) x=0;
         else x=(Open[i+k]*UseOpen+Close[i+k]*UseClose+High[i+k]*UseHigh+Low[i+k]*UseLow)/(UseOpen+UseClose+UseHigh+UseLow);
         if((UseOpen+UseClose+UseHigh+UseLow)==0) y=0;
         else y=(iOpen(OtherChart,0,i+k)*UseOpen+iClose(OtherChart,0,i+k)*UseClose+iHigh(OtherChart,0,i+k)*UseHigh+iLow(OtherChart,0,i+k)*UseLow)/(UseOpen+UseClose+UseHigh+UseLow);
         sx+=x;sy+=y;
        }
      sx/=n;sy/=n;
      cor1=0;cor2=0;cor3=0;
      for(k=0; k<n; k++)
        {
         if((UseOpen+UseClose+UseHigh+UseLow)==0) x=0;
         else x=(Open[i+k]*UseOpen+Close[i+k]*UseClose+High[i+k]*UseHigh+Low[i+k]*UseLow)/(UseOpen+UseClose+UseHigh+UseLow);
         if((UseOpen+UseClose+UseHigh+UseLow)==0) y=0;
         else y=(iOpen(OtherChart,0,i+k)*UseOpen+iClose(OtherChart,0,i+k)*UseClose+iHigh(OtherChart,0,i+k)*UseHigh+iLow(OtherChart,0,i+k)*UseLow)/(UseOpen+UseClose+UseHigh+UseLow);
         cor1+=(x-sx)*(y-sy);
         cor2+=(x-sx)*(x-sx);
         cor3+=(y-sy)*(y-sy);
        }
      Buffer[i]=cor1/MathSqrt(cor2)/MathSqrt(cor3);
     }
//----
   return(0);
  }
//+------------------------------------------------------------------+
Comments