correlation_Pearson
Download script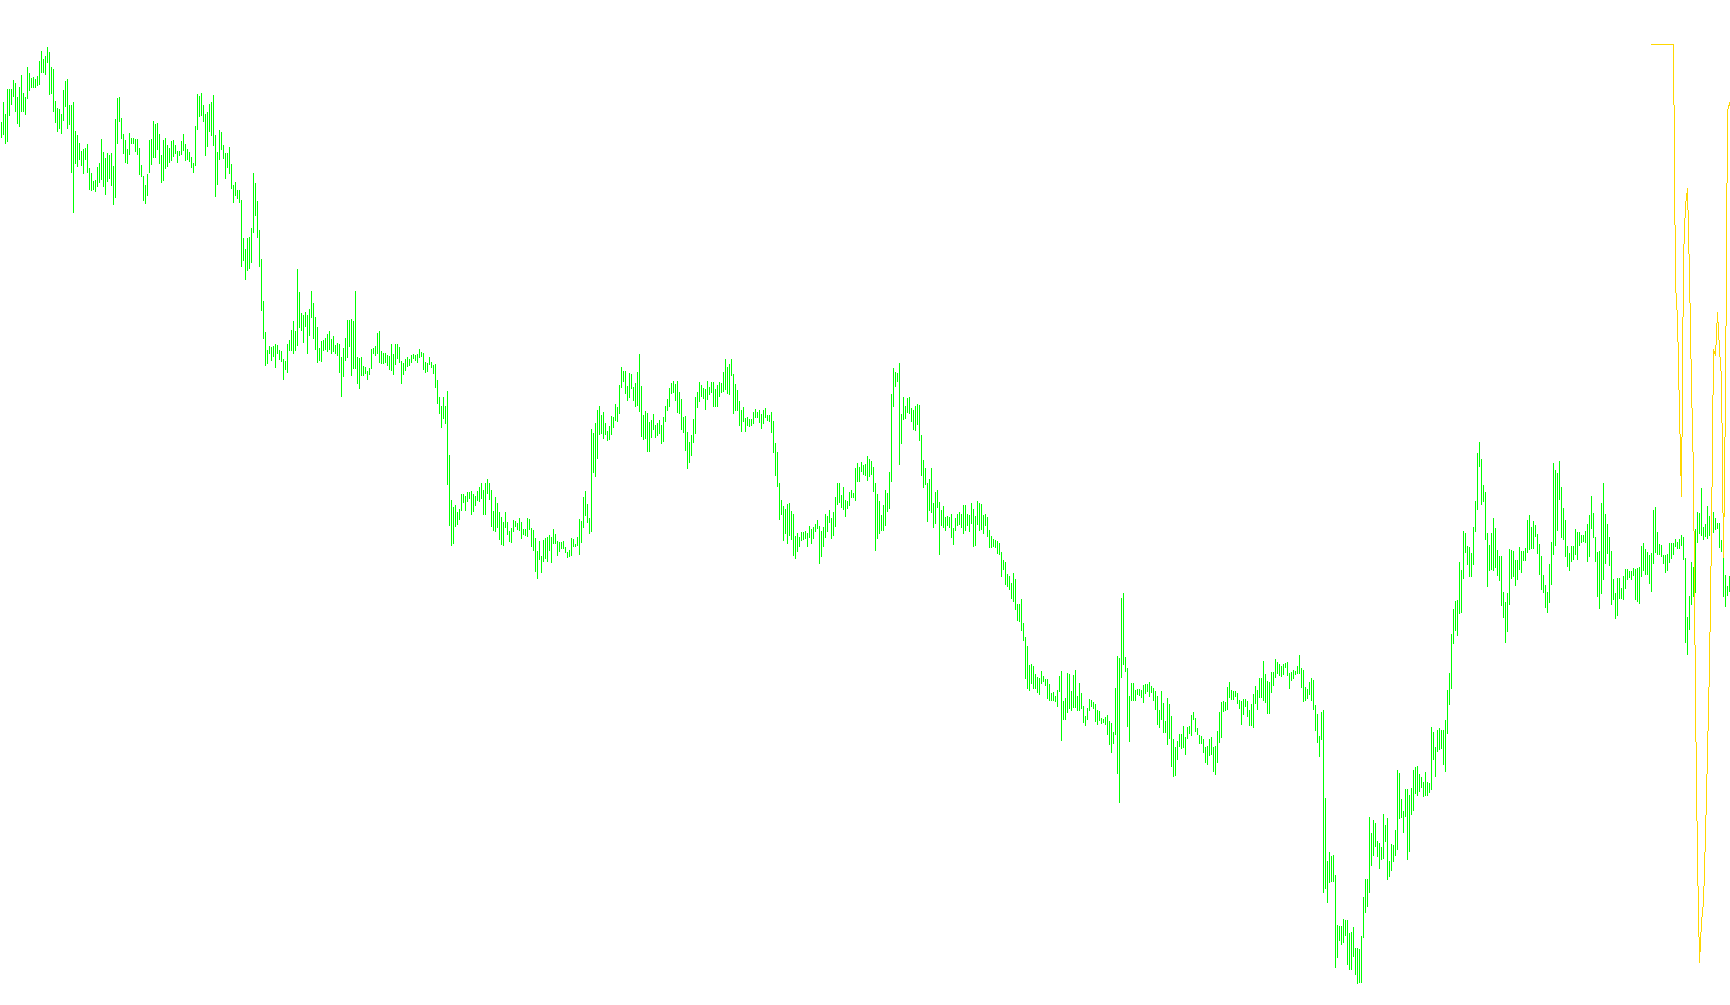
This tool is designed to analyze the relationship between two different financial assets (such as currency pairs) by measuring how closely they move in tandem. Specifically, it utilizes a mathematical method known as the Pearson Correlation Coefficient to provide a visual representation of market synchronization.
How the Logic Works
The script functions by examining the historical price data of two selected instruments over a specific timeframe. Here is the step-by-step breakdown of its internal logic:
- Data Selection: The user defines two specific currency pairs and a "Period" (the window of time the tool looks back at). For example, if the period is set to 13, the tool focuses on the most recent 13 price points.
- Price Tracking: The script automatically captures the opening prices for both chosen assets. It aligns these two sets of data side-by-side to see how they behaved during the exact same moments in time.
- Mathematical Comparison: The core logic performs a series of calculations to determine the "co-movement" of these prices. It looks at:
- The average price movement of both assets.
- How much each asset fluctuates (its volatility).
- The degree to which one asset's price increases or decreases in relation to the other.
- Correlation Calculation: By processing these variables, the tool produces a single numerical value. This value represents the strength and direction of the relationship:
- A high positive correlation suggests that when one asset goes up, the other tends to go up as well.
- A negative correlation suggests that they move in opposite directions.
- A low correlation indicates that the two assets are moving independently of one another.
- Visual Output: The results are plotted on a separate window in your trading platform as a line graph. This allows you to see, in real-time, whether the historical bond between these two assets is strengthening, weakening, or shifting.
Practical Purpose
By using this logic, traders can better understand market dynamics. Instead of guessing how different currencies might react to global events, this tool provides an objective measure of their interconnectedness, helping to identify when assets are following each other's lead or diverging into new trends.
//+------------------------------------------------------------------+
//|                                          correlation_Pearson.mq4 |
//|                                         Copyright ? 2006, zolero |
//|       made to help albedo@email.it who shared a wish to see this |
//|                                            indicator working ;)  |
//+------------------------------------------------------------------+
#property copyright "Copyright ? 2006, idea: albedo@email.it"

#property indicator_separate_window
#property indicator_buffers 1
#property indicator_color1 Red
extern int R_Period=13;
extern string Pair1="GBPJPY";
extern string Pair2="USDJPY";
double R[];
double X[],Y[];
//+------------------------------------------------------------------+
//| Custom indicator initialization function                         |
//+------------------------------------------------------------------+
int init()
  {
//---- indicators
//---- drawing settings
   SetIndexStyle(1,DRAW_LINE);
   IndicatorShortName(Pair1+"/"+Pair2+"  R("+R_Period+")");
   SetIndexStyle(0,DRAW_LINE);
   SetIndexBuffer(0,R);
//----
   return(0);
  }
//+------------------------------------------------------------------+
//| Custom indicator deinitialization function                       |
//+------------------------------------------------------------------+
int deinit()
  {
//----

//----
   return(0);
  }
//+------------------------------------------------------------------+
//| Custom indicator iteration function                              |
//+------------------------------------------------------------------+
int start()
  {
   int    counted_bars=IndicatorCounted();
//----
  double X[],Y[];
  int piir, limit, omega;
  double sumxy, sumx, sumx2, sumy, sumy2;
  double yks, kaks, kolm;

  limit=Bars-counted_bars; //always just 1 bar after first calculation
  if(counted_bars==0) limit=Bars-R_Period-1; //first time it should be enough bars to calculate
  ArrayResize(X,limit); // min size of array is using less memory
  ArrayResize(Y,limit);
  ArrayCopySeries(X,MODE_OPEN,Pair1,0);
  ArrayCopySeries(Y,MODE_OPEN,Pair2,0);

  omega=0;
  while(omega<=limit)
  {
  sumxy=0; sumx=0; sumx2=0;
  sumy=0; sumy2=0;
  for(int i=1; i<=R_Period; i++)
  {
  sumxy+=X[omega+i]*Y[omega+i];
  sumx+=X[omega+i];
  sumx2+=MathPow(X[omega+i],2.); //2. is neccesary because MathPow wants both parts as double
  sumy+=Y[omega+i];
  sumy2+=MathPow(Y[omega+i],2.);//but it seems to work with "2" as well
  }

  yks=sumxy-(sumx*sumy)/R_Period;
  kaks=sumx2-(MathPow(sumx,2.)/R_Period);
  kolm=sumy2-(MathPow(sumy,2.)/R_Period);

  R[omega]=(yks/MathSqrt(kaks*kolm));
  omega++;
  }
//----
   return(0);
  }
//+------------------------------------------------------------------+
Comments