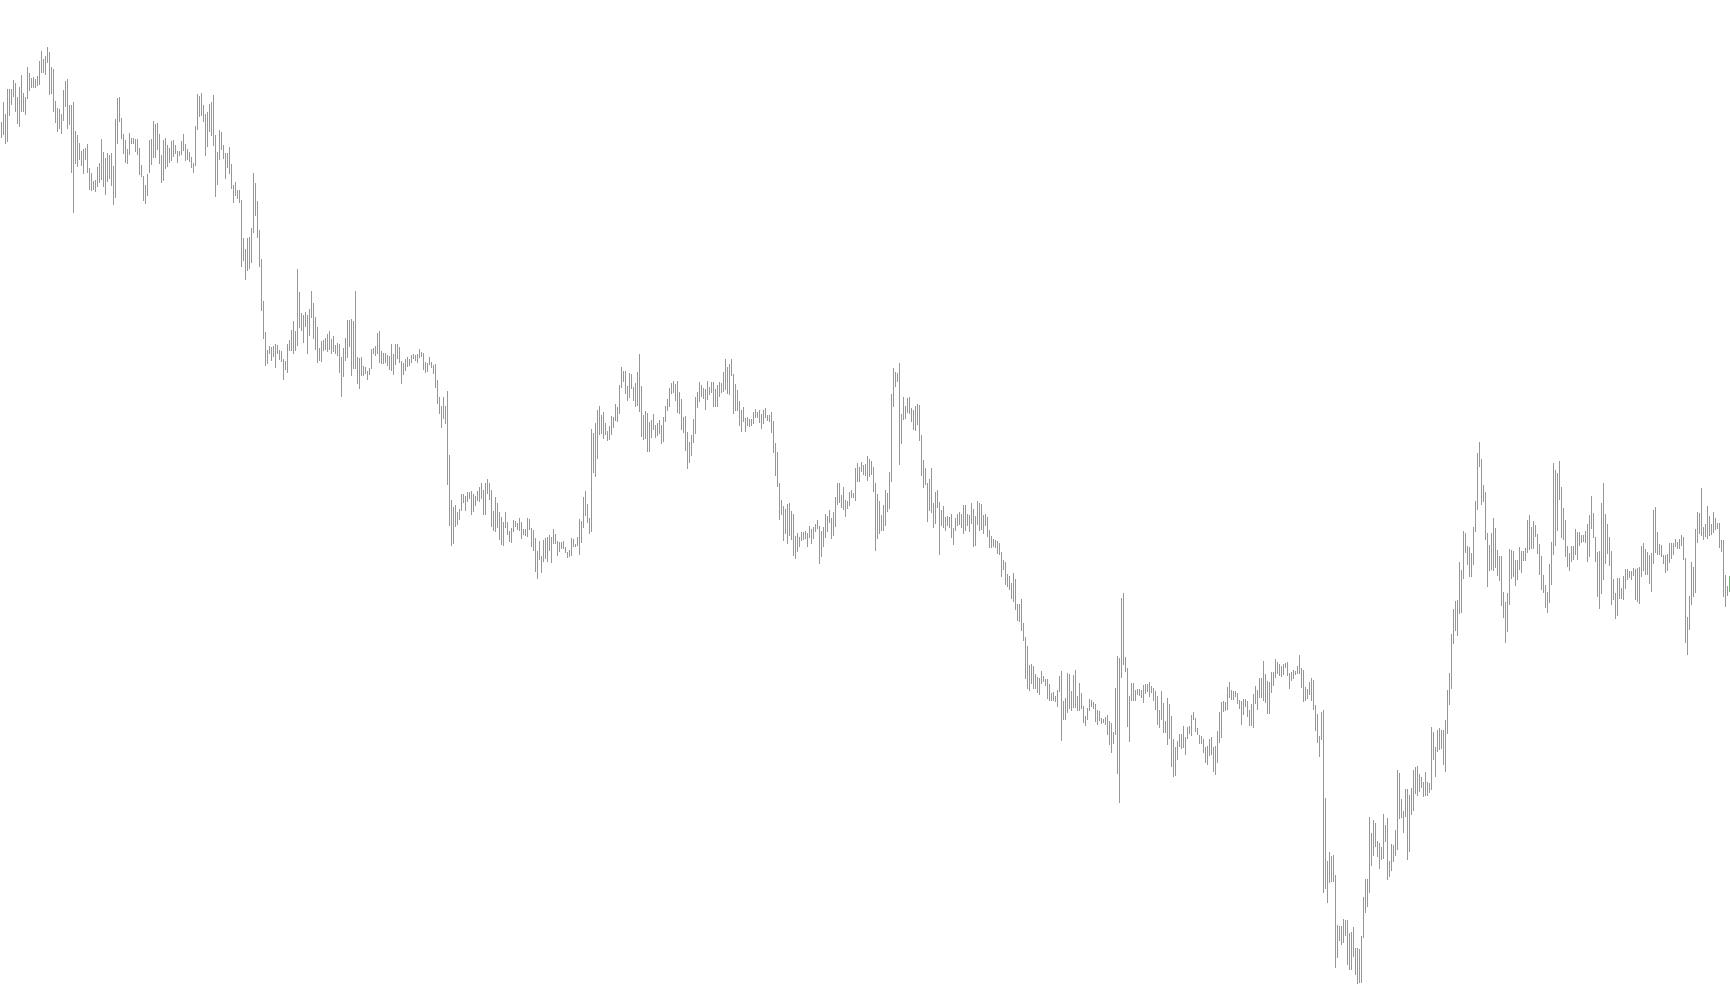
This tool is designed to provide a visual trend signal on your trading chart by calculating the relationship between two different types of price averages. Instead of simply looking at raw prices, it analyzes the "momentum" and "smoothness" of market movements to generate a dynamic indicator line.
How the Logic Works
The script operates by performing three main mathematical steps to determine where the indicator should appear on your screen:
1. Data Gathering and Smoothing The tool looks back at a specific number of historical bars (which you can customize) to understand the recent price action. It focuses on the "Median Price"—the midpoint between the high and low of each candle—rather than just the closing price. This helps filter out minor market noise.
2. Dual-Path Calculation The core logic splits the market data into two different types of calculations:
- Standard Smoothing: It calculates a basic weighted average of the current market prices to establish a baseline of where the market is currently trading.
- Weighted Trend Analysis: It applies a specific weighting system (using a user-defined number of "dots") to the price data. This gives more importance to certain points in the recent timeline, helping the script identify the underlying direction of the trend more clearly than a standard moving average would.
3. The Final Signal Generation The final indicator line is created by comparing these two paths. Specifically:
- It measures the difference between the "Weighted Trend" and the "Standard Smoothing."
- It applies a logarithmic calculation to this difference to determine the strength of the deviation.
- Finally, it adjusts the current closing price based on this result to produce the green line you see on your chart.
Summary for the User
Essentially, this script acts as a sophisticated filter. It compares a "weighted" version of the market's movement against a "standard" version. When the market moves aggressively in one direction, the gap between these two calculations expands or contracts; the script translates that gap into the green line on your chart, helping you visualize the current momentum and price orientation more clearly.
//+------------------------------------------------------------------+
//| Cool2.mq4
//| Ramdass - Conversion only
//+------------------------------------------------------------------+

#property indicator_chart_window
#property indicator_buffers 1
#property indicator_color1 LawnGreen


extern int ndot=5;
extern int CountBars=300;
//---- buffers
double cfl[];


//+------------------------------------------------------------------+
//| Custom indicator initialization function                         |
//+------------------------------------------------------------------+
int init()
  {
   string short_name;
//---- indicator line
   IndicatorBuffers(1);
   SetIndexStyle(0,DRAW_LINE);
   SetIndexBuffer(0,cfl);
//----
   return(0);
  }
//+------------------------------------------------------------------+
//| Cool2                                                              |
//+------------------------------------------------------------------+
int start()
  {


   if (CountBars>=Bars) CountBars=Bars;
   SetIndexDrawBegin(0,Bars-CountBars+ndot+1);
   int i,shift,cnt,ndot1,counted_bars=IndicatorCounted();
   double TYVar,ZYVar,TIndicatorVar,ZIndicatorVar,M,N,AY,AIndicator;
//----
   if(Bars<=ndot) return(0);

//----
   shift=CountBars-ndot-1;


   while(shift>=0)
     {

   TYVar=0;
	ZYVar=0;
	N=0;
	M=0;
	TIndicatorVar=0;
	ZIndicatorVar=0;
	ndot1=ndot;
	if (shift+1<ndot1) ndot1=shift+1;
	for (cnt=ndot; cnt>=1; cnt--) // n=5 -  ïî ïÿòè òî÷êàì
	{
		N=N+cnt*cnt;  //ðàâíî 55
		M=M+cnt;      //ðàâíî 15
	}
	for (cnt=ndot1; cnt>=1; cnt--) // n=5 -  ïî ïÿòè òî÷êàì
	{
		ZYVar=ZYVar+(High[shift-cnt+1]+Low[shift-cnt+1])/2*(ndot+1-cnt);
		TYVar=TYVar+(High[shift-cnt+1]+Low[shift-cnt+1])/2;
		ZIndicatorVar=ZIndicatorVar+iMA(NULL,0,5,3,MODE_SMMA,PRICE_MEDIAN,shift-cnt+1)*(ndot+1-cnt);
		TIndicatorVar=TIndicatorVar+iMA(NULL,0,5,3,MODE_SMMA,PRICE_MEDIAN,shift-cnt+1);
	}
	AY=(TYVar+(N-2*ZYVar)*ndot/M)/M;
	AIndicator=(TIndicatorVar+(N-2*ZIndicatorVar)*ndot/M)/M;
	cfl[shift]=Close[shift]+((-1000)*MathLog(AY/AIndicator)/500);


      shift--;
     }
   return(0);
  }
//+------------------------------------------------------------------+
Comments