Oscillator of ATR
Download script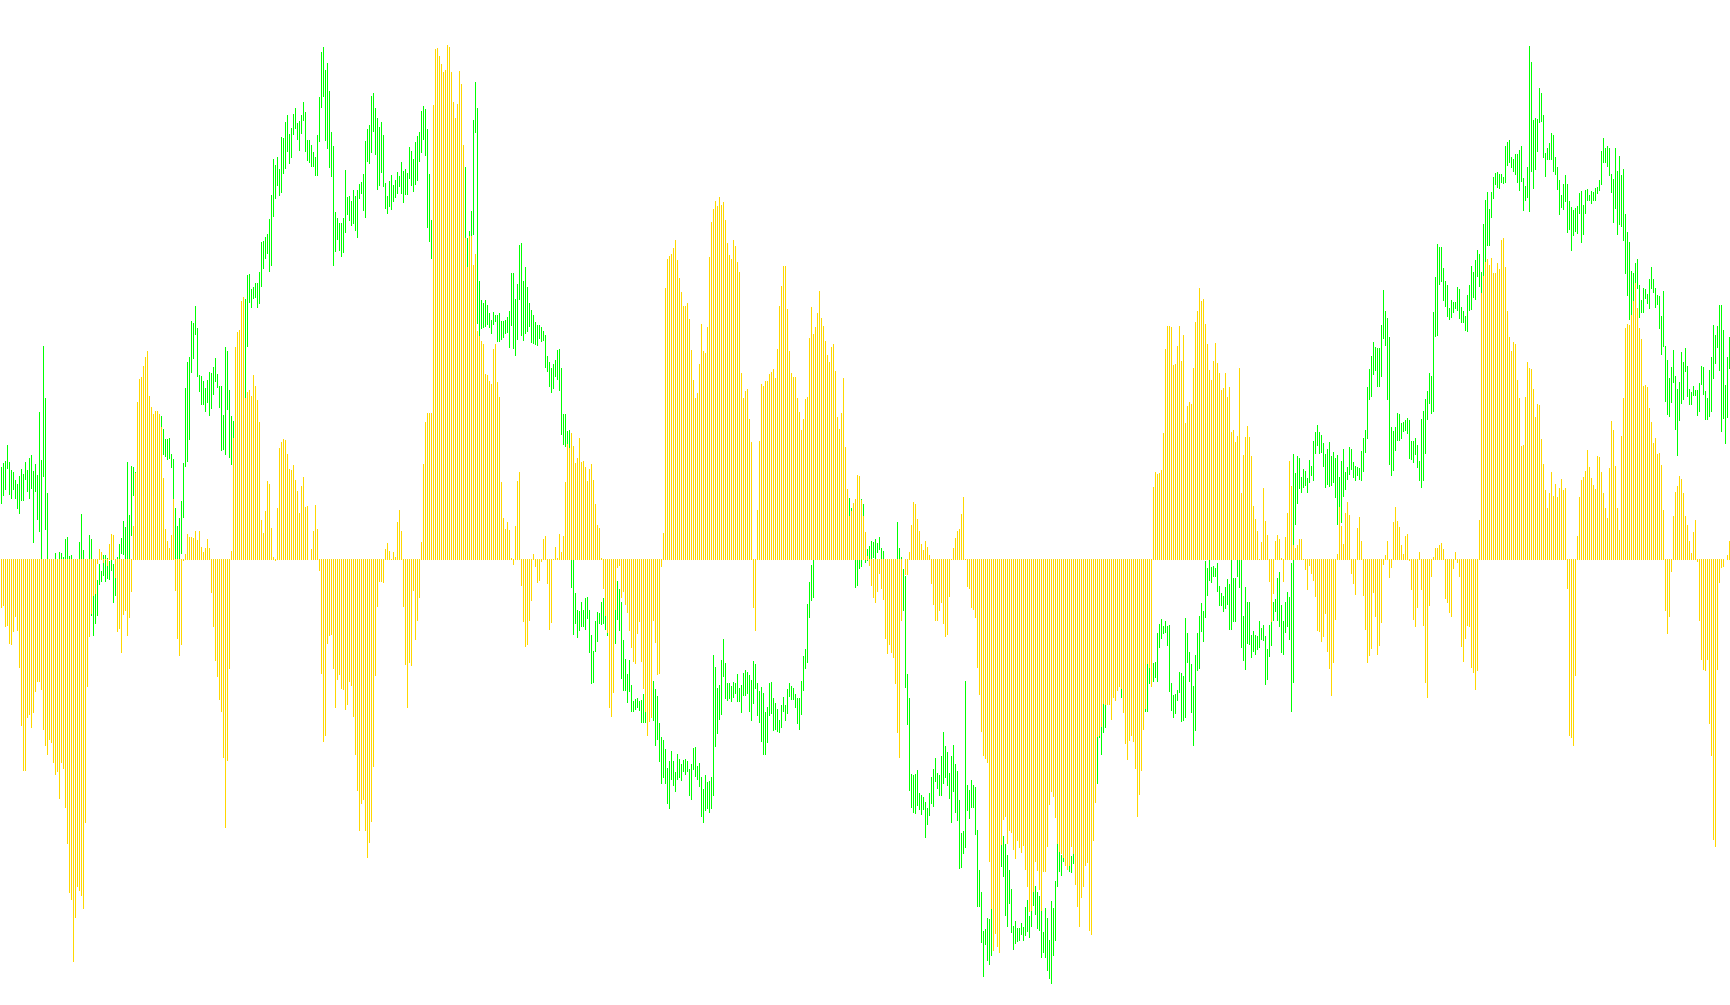
This indicator is designed to help traders visualize market volatility by measuring the fluctuations in price over specific timeframes. Instead of focusing on whether the price is going up or down, it focuses on how much the price is "moving" or swinging.
Core Logic and Functionality
1. Measuring Price Movement The script begins by analyzing the relationship between the current price range (the distance between the highest and lowest points) and the previous closing price. It creates a specialized value that captures these movements, effectively measuring how much "stretch" or "expansion" is happening in the market at any given moment.
2. Scaling the Data To make these fluctuations easier to read on a standard chart window, the script applies a multiplier to the raw data. This ensures that even small price movements are represented clearly enough for a trader to see patterns without the numbers becoming overwhelming or insignificant.
3. Comparing Different Timeframes The core of this indicator lies in its ability to compare two different speeds of market movement simultaneously:
- It looks at a "Long-Term" movement (based on a primary period).
- It looks at a "Short-Term" movement (based on a secondary period).
By calculating the difference between these two periods, the script produces an oscillator.
How to Interpret the Results
The resulting visual is displayed as a histogram in a separate window below your main price chart.
- When the indicator is above the zero line: It suggests that the longer-term volatility is currently higher than the shorter-term volatility, which can indicate a sustained period of active price movement or a shift in market intensity.
- When the indicator is below the zero line: It suggests that the short-term fluctuations are outweighing the long-term trends, often highlighting periods of compression, cooling off, or localized "noise" in the price action.
Summary for Traders
Essentially, this tool acts as a "volatility thermometer." It allows you to see whether the market is accelerating its movements relative to its recent history or if it is entering a period of stability. By identifying these shifts in momentum and range, traders can better understand the underlying energy of the market regardless of the specific direction of the price.
//+------------------------------------------------------------------+
//|                                            Oscillator of ATR.mq4 |
//|                                                   vasbsm@mail.ru |
//|                                                                  |
//+------------------------------------------------------------------+
#property copyright "vasbsm@mail.ru"
#property link      ""

#property indicator_separate_window
#property indicator_buffers 1
#property indicator_color1 DodgerBlue
#property indicator_width1 3
//---- input parameters
extern int       FirstAtrPeriod=138;
extern int       SecondAtrPeriod=94;
extern int       TypeMA=0;
//-----------------------
double OscAtrBuffer[];
double TempBuffer[];
//------------------------
int init()
  {
   string short_name;
   IndicatorBuffers(2);
   SetIndexStyle(0,DRAW_HISTOGRAM);
   SetIndexBuffer(0,OscAtrBuffer);
   SetIndexBuffer(1,TempBuffer);
   short_name="Oscillator of ATR("+FirstAtrPeriod+","+SecondAtrPeriod+","+"Type of MA="+TypeMA+")";
   IndicatorShortName(short_name);
   SetIndexLabel(0,short_name);
   SetIndexDrawBegin(0,FirstAtrPeriod);
   return(0);
  }
//---------------------------------------------
int start()
  {
   int    counted_bars=IndicatorCounted(),i;
   if(Bars<=FirstAtrPeriod) return(0);
   if(counted_bars<1)
      for(i=1;i<=FirstAtrPeriod;i++) OscAtrBuffer[Bars-i]=0.0;
   //----------------
      i=Bars-counted_bars-1;
   while(i>=0)
     {
      double high=High[i];
      double low =Low[i];
      if(i==Bars-1) TempBuffer[i]=high-low;
      else
        {
         double prevclose=Close[i+1];
         TempBuffer[i]=1000*(MathMax(high,prevclose)-MathMin(low,prevclose));
        }
      i--;
     }
    //---------------
   if(counted_bars>0) counted_bars--;
   int limit=Bars-counted_bars;
   for(i=0; i<limit; i++)
      OscAtrBuffer[i]=iMAOnArray(TempBuffer,Bars,FirstAtrPeriod,0,TypeMA,i)-iMAOnArray(TempBuffer,Bars,SecondAtrPeriod,0,TypeMA,i);
    //---------------
   return(0);
  }
//+------------------------------------------------------------------+
Comments