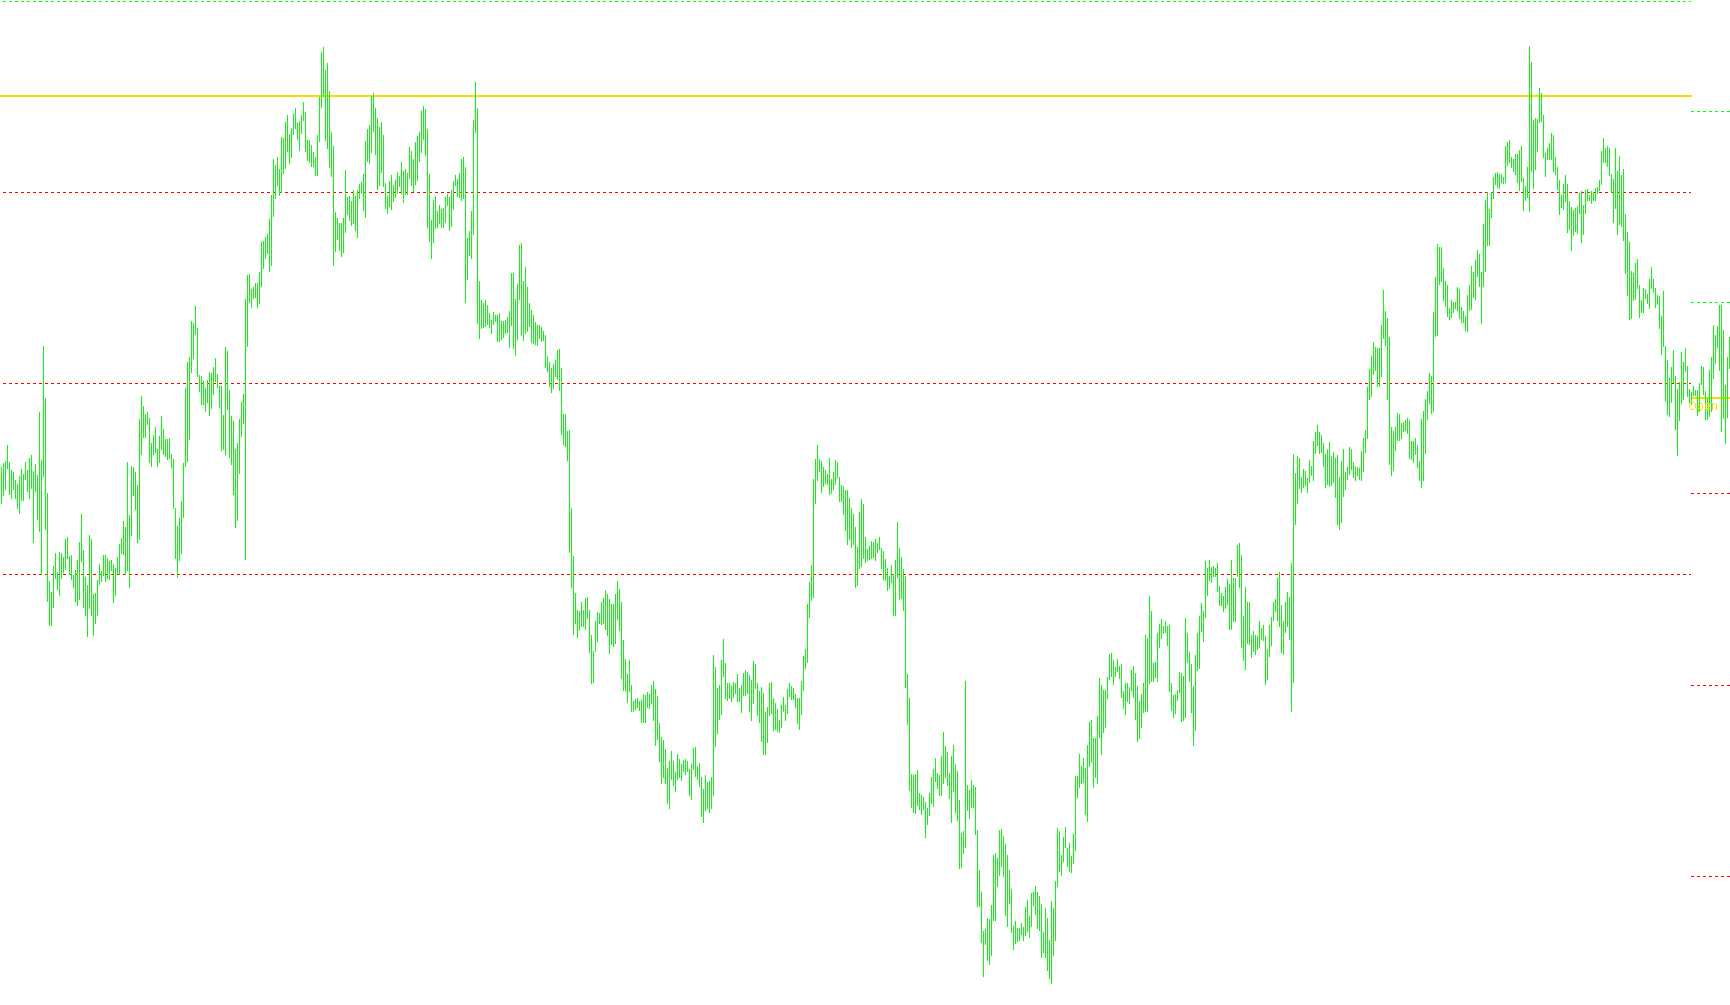
This script is designed to automatically calculate and display historical price levels on your trading chart. It helps traders visualize key support and resistance zones based on daily price action, making it easier to identify potential turning points in the market.
Core Functionality
The tool analyzes a specific number of previous days (adjustable by the user) to determine three primary components:
- The Pivot Point: This is the central reference level for the day. The script calculates this based on either the "Open" price or a mathematical average of the high, low, and closing prices from the previous period.
- Upper Levels (Resistance): It projects three distinct levels above the Pivot Point. These represent potential areas where upward price momentum might face selling pressure.
- Lower Levels (Support): It projects three distinct levels below the Pivot Point. These represent potential areas where downward price momentum might find a "floor" and bounce back up.
How it Works
- Data Gathering: The script automatically looks back at the historical data for the number of days you specify. It identifies the highest and lowest prices reached during those periods to establish the market's range.
- Calculation Logic: Using these highs, lows, and opening/closing prices, it calculates the "Pivot" value. It then applies specific multipliers (levels) to that price to find the exact coordinates for the upper and lower lines.
- Visual Mapping: Once calculated, the script draws these levels directly onto your chart. It uses distinct colors—typically Gold for the central Pivot, Lime for the upper resistance levels, and Red for the lower support levels—to ensure clarity.
- Dynamic Updating: The tool is designed to refresh automatically. Every time a new day begins, it cleans the previous visual data and redraws the updated levels based on the latest market movements.
User Customization
The logic allows for several personal adjustments to suit different trading styles:
- Timezone Adjustment: You can synchronize the calculations with specific GMT offsets.
- Visual Style: You can choose whether to display the "Open" price as your primary pivot or the traditional average.
- Density: You can adjust how many days of history the script should analyze and customize the thickness, style, and color of the lines to match your chart's aesthetic.
Price Data Components
9
Views
0
Downloads
0
Favorites
Open_Pivot_PlusLevels_Historical
//+------------------------------------------------------------------+
//|                             Open_Pivot_PlusLevels_Historical.mq4 |
//|    Based on AllPivots code by IgorAD - adapted & Modified by cja |
//+------------------------------------------------------------------+
#property copyright "Adapted by cja - 2010"

#property indicator_chart_window
//---- input parameters
extern int    CountDays       = 10;
extern int    GMT             = 0;
extern bool  Show_Open        = true;
extern color Open_Pivot_Color = Gold;
extern int   Open_Pivot_width = 2;
extern int Level_1            = 25;
extern int Level_2            = 75;
extern int Level_3            = 125;
extern color Upper_Color      = Lime;
extern color Lower_Color      = Red;
extern int Line_width         = 1;
extern int Line_style         = 2;

extern string Font            = "Tahoma Narrow";
extern int    Fontsize        = 9;

int magic;

//---- indicator buffers
double range[];
double timeshift[];
double low[];
double high[];
datetime time1;
datetime time2;
datetime start_time[];

int shift, num;
int ny_shift[];
datetime prevDay=0;
bool fTime;


double myPoint;
   double SetPoint()
   { double mPoint;
   if (Digits < 4)
   mPoint = 0.01;
   else mPoint = 0.0001;
   return(mPoint);
   }

// ----
void ObjDel()
{
   if (ObjectsTotal() > 0)
   for (num=0;num<=CountDays;num++)
   {
   ObjectDelete("OP["+num+"]"+magic);
   ObjectDelete("UP1["+num+"]"+magic);
   ObjectDelete("UP2["+num+"]"+magic);
   ObjectDelete("UP3["+num+"]"+magic);

   ObjectDelete("DN1["+num+"]"+magic);
   ObjectDelete("DN2["+num+"]"+magic);
   ObjectDelete("DN3["+num+"]"+magic);

   }

   ObjectDelete("textP"+magic);
   ObjectDelete("op"+magic);
   ObjectDelete("up1"+magic);
   ObjectDelete("up2"+magic);
   ObjectDelete("up3"+magic);

   ObjectDelete("dn1"+magic);
   ObjectDelete("dn2"+magic);
   ObjectDelete("dn3"+magic);


}
// ----
void PlotLine(string name,double value,double value1,double line_color,double style,double width)
{
   double valueN=NormalizeDouble(value,Digits);
   double valueN1=NormalizeDouble(value1,Digits);
   bool res = ObjectCreate(name,OBJ_TREND,0,time1,valueN,time2,valueN1);
   ObjectSet(name, OBJPROP_WIDTH, width);
   ObjectSet(name, OBJPROP_STYLE, style);
   ObjectSet(name, OBJPROP_RAY, false);
   ObjectSet(name, OBJPROP_BACK, true);
   ObjectSet(name, OBJPROP_COLOR, line_color);
}
//***********
void PlotPrice(string name, double value, double line_color)
{
    double valueN=NormalizeDouble(value,Digits);
    bool res = ObjectCreate(name, OBJ_ARROW, 0, time2,valueN);
    ObjectSet(name, OBJPROP_COLOR, line_color);
    ObjectSet(name, OBJPROP_WIDTH, 1);
    ObjectSet(name, OBJPROP_ARROWCODE, SYMBOL_RIGHTPRICE);
}


void Plottext(string name,string LabelText, int FontSize, string FontName, double value, double line_color)
{
    double valueN=NormalizeDouble(value,Digits);
    bool res = ObjectCreate(name, OBJ_TEXT, 0, time1,valueN);
    ObjectSetText(name, LabelText, FontSize, FontName, line_color);
   }


//+------------------------------------------------------------------+
//| Custom indicator initialization function                         |
//+------------------------------------------------------------------+
int init()
{
   fTime = true;
   IndicatorBuffers(2);
   SetIndexBuffer(0,range);
   SetIndexBuffer(1,timeshift);
   myPoint = SetPoint();
   return(0);
}

//+------------------------------------------------------------------+
//| Custor indicator deinitialization function                       |
//+------------------------------------------------------------------+
int deinit()
{
   ObjDel();
   Comment("");
   return(0);
}
//+------------------------------------------------------------------+
//| LNX_Pivots_v3.1                                                  |
//+------------------------------------------------------------------+
int start()
{
   magic=234+GMT+Show_Open;
   int i;
   double P,R1,R2,R3,R4,S1,S2,S3,S4;

   datetime cDay = iTime(NULL,PERIOD_D1,0) + (GMT-Period()/60.0)*3600;
   if (cDay != prevDay || fTime)
   {
   ObjDel();
   ArrayResize(start_time,CountDays);
   ArrayResize(ny_shift,CountDays);
   ArrayResize(high,CountDays);
   ArrayResize(low,CountDays);
   ArrayResize(range,CountDays);
      for (shift=0;shift<=CountDays;shift++)
      {
      start_time[shift]  = iTime(NULL,PERIOD_D1,shift) + (GMT-Period()/60.0)*3600;
      ny_shift[shift] = iBarShift(NULL,0,start_time[shift]);
      timeshift[shift] = iClose(NULL,0,ny_shift[shift]);

      }

      for (shift=0;shift<=CountDays-1;shift++)
      {
      int length = ny_shift[shift+1]-ny_shift[shift];

      high[shift] = High[iHighest(NULL,0,MODE_HIGH,length,ny_shift[shift])];
      low[shift]  = Low[iLowest(NULL,0,MODE_LOW,length,ny_shift[shift])];
      range[shift] = high[shift] - low[shift];
      }

      for (shift=0;shift<=CountDays-1;shift++)
      {

      if(DayOfWeek()==0){ P  = (timeshift[shift+1]+high[shift+1]+low[shift+1])/3;}else{
      P  = (timeshift[shift]+high[shift]+low[shift])/3;}

      if(Show_Open){
      P=timeshift[shift];
      }else{P  = (timeshift[shift]+high[shift]+low[shift])/3;}


      double UP = P+ Level_1*myPoint;
      double DN = P- Level_1*myPoint;
      double UP1 = P+ Level_2*myPoint;
      double DN1 = P- Level_2*myPoint;
      double UP2 = P+ Level_3*myPoint;
      double DN2 = P- Level_3*myPoint;

      time1 = start_time[shift]+Period()*60;

         if (shift==0)
         {
         time2 = start_time[shift] + 24*3600+Period()*60 ;

         if(Show_Open){
         Plottext("textP"+magic,"        Open",Fontsize,Font,P,Open_Pivot_Color);
         }else{Plottext("textP"+magic,"        Pivot",Fontsize,Font,P,Open_Pivot_Color);}

         PlotPrice("op"+magic,P,Open_Pivot_Color);
         PlotPrice("up1"+magic,UP,Upper_Color);
         PlotPrice("up2"+magic,UP1,Upper_Color);
         PlotPrice("up3"+magic,UP2,Upper_Color);
         PlotPrice("dn1"+magic,DN,Lower_Color);
         PlotPrice("dn2"+magic,DN1,Lower_Color);
         PlotPrice("dn3"+magic,DN2,Lower_Color);

         }
         else
         time2 = start_time[shift-1]+Period()*60;

   PlotLine("OP["+shift+"]"+magic,P,P,Open_Pivot_Color,0,Open_Pivot_width);

   PlotLine("UP1["+shift+"]"+magic,UP,UP,Upper_Color,Line_style,0);
   PlotLine("UP2["+shift+"]"+magic,UP1,UP1,Upper_Color,Line_style,0);
   PlotLine("UP3["+shift+"]"+magic,UP2,UP2,Upper_Color,Line_style,0);

   PlotLine("DN1["+shift+"]"+magic,DN,DN,Lower_Color,Line_style,0);
   PlotLine("DN2["+shift+"]"+magic,DN1,DN1,Lower_Color,Line_style,0);
   PlotLine("DN3["+shift+"]"+magic,DN2,DN2,Lower_Color,Line_style,0);

}
   fTime = false;
   prevDay = cDay;
   }

   return(0);
}
//+------------------------------------------------------------------+
Comments