okwhHeikenAshi
Download script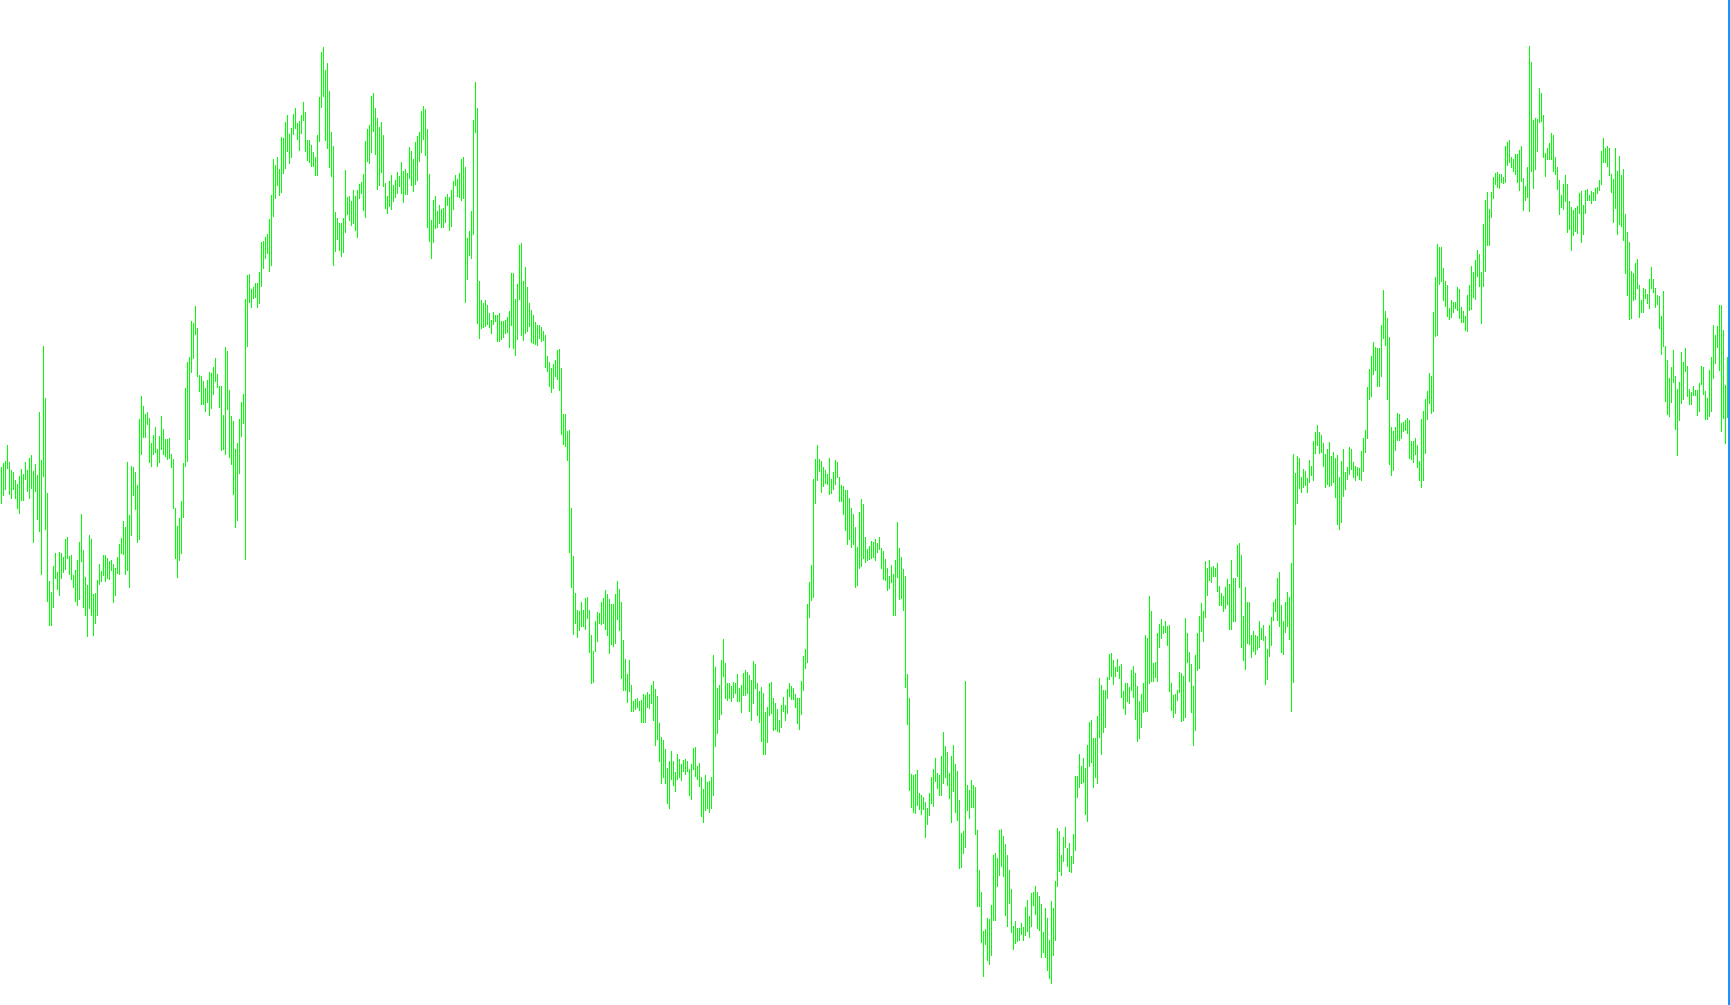
This script is designed to transform standard price movements into a specialized visual format known as Heikin Ashi. While traditional charts show raw price data (where every candle is independent), this tool applies a mathematical smoothing logic to create "averages" that help traders visualize market trends more clearly by reducing visual noise.
Core Functionality
The script analyzes the historical price data of a specific currency pair—which you can define in the settings—and recalculates the "Open," "High," "Low," and "Close" values for every candle on your chart. Instead of displaying raw fluctuations, it creates a balanced representation where each candle's shape is derived from the previous candle's data.
How the Logic Works
The script performs three primary calculations to generate these visual results:
- Trend Smoothing: It calculates the opening price of a new candle by taking the average of the previous candle's high and low points. This ensures that the "start" of a new price bar is logically linked to where the previous one ended.
- Price Averaging: The closing price of each candle is calculated as a weighted average of the current period's high, low, open, and close prices. By applying a specific ratio (the
bilivariable), the script stabilizes the price action so that it doesn't jump erratically. - Dynamic Range Scaling: The script then determines the highest and lowest points for each candle. It compares the smoothed "Open" and "Close" values against the actual highs and lows of the market. Depending on whether the price is moving upward or downward, it assigns these values to different visual layers (buffers) to create the distinct solid colors seen on the chart.
User Experience
From a practical standpoint, this script provides a real-time overlay. As new data comes in:
- It identifies which currency pair you want to monitor.
- It performs the smoothing calculations across all historical bars.
- It displays a "Comment" on your screen showing the current price of that specific pair.
- It renders the smoothed candles as a histogram, allowing you to see the direction and strength of the trend more easily than standard candles might provide.
//+------------------------------------------------------------------+
//|                                              okwhHeiken Ashi.mq4 |
//|                                      http://agiler.brinkster.net |
//|                                  http://blog.sina.com.cn/FXTrade |
//|    changed bu okwh of China, for desplay different in same char  |
//+------------------------------------------------------------------+
//| For Heiken Ashi we recommend next chart settings ( press F8 or   |
//| select on menu 'Charts'->'Properties...'):                       |
//|  - On 'Color' Tab select 'Black' for 'Line Graph'                |
//|  - On 'Common' Tab disable 'Chart on Foreground' checkbox and    |
//|    select 'Line Chart' radiobutton                               |
//+------------------------------------------------------------------+
#property copyright "Copyright © 2004, MetaQuotes Software Corp."
#property link      "http://www.metaquotes.net"

#property indicator_chart_window
#property indicator_buffers 4
#property indicator_color1 Red
#property indicator_color2 White
#property indicator_color3 Red
#property indicator_color4 White

extern string which = "EURJPY";  //set what you want to dispaly
extern double bili = 0.707;      // set the ratio for coordinates format
//---- buffers
double ExtMapBuffer1[];
double ExtMapBuffer2[];
double ExtMapBuffer3[];
double ExtMapBuffer4[];
//----
int ExtCountedBars=0;
//+------------------------------------------------------------------+
//| Custom indicator initialization function                         |
//|------------------------------------------------------------------|
int init()
  {
//---- indicators
   SetIndexStyle(0,DRAW_HISTOGRAM, 0, 1);
   SetIndexBuffer(0, ExtMapBuffer1);
   SetIndexStyle(1,DRAW_HISTOGRAM, 0, 1);
   SetIndexBuffer(1, ExtMapBuffer2);
   SetIndexStyle(2,DRAW_HISTOGRAM, 0, 2);
   SetIndexBuffer(2, ExtMapBuffer3);
   SetIndexStyle(3,DRAW_HISTOGRAM, 0, 2);
   SetIndexBuffer(3, ExtMapBuffer4);
//----
   SetIndexDrawBegin(0,10);
   SetIndexDrawBegin(1,10);
   SetIndexDrawBegin(2,10);
   SetIndexDrawBegin(3,10);
//---- indicator buffers mapping
   SetIndexBuffer(0,ExtMapBuffer1);
   SetIndexBuffer(1,ExtMapBuffer2);
 //  SetIndexBuffer(2,ExtMapBuffer3);
 //  SetIndexBuffer(3,ExtMapBuffer4);
//---- initialization done
   return(0);
  }
//+------------------------------------------------------------------+
//| Custom indicator deinitialization function                       |
//+------------------------------------------------------------------+
int deinit()
  {
//---- TODO: add your code here

//----
   return(0);
  }
//+------------------------------------------------------------------+
//| Custom indicator iteration function                              |
//+------------------------------------------------------------------+
int start()
  {
   SetIndexStyle(0,DRAW_HISTOGRAM, 0, 1);
   SetIndexStyle(1,DRAW_HISTOGRAM, 0, 1);
   SetIndexStyle(2,DRAW_HISTOGRAM, 0, 2);
   SetIndexStyle(3,DRAW_HISTOGRAM, 0, 2);
  Comment(which," is ",iClose(which,0,0)," now");
   double haOpen, haHigh, haLow, haClose;
   if(Bars<=10) return(0);
   ExtCountedBars=IndicatorCounted();
//---- check for possible errors
   if (ExtCountedBars<0) return(-1);
//---- last counted bar will be recounted
   if (ExtCountedBars>0) ExtCountedBars--;
   int pos=Bars-ExtCountedBars-1;
   while(pos>=0)
     {
      haOpen=(ExtMapBuffer3[pos+1]+ExtMapBuffer4[pos+1])/2;
      haClose=(iOpen(which,0,pos)+iHigh(which,0,pos)+iLow(which,0,pos)+iClose(which,0,pos))*bili/4;
      haHigh=MathMax(iHigh(which,0,pos)*bili, MathMax(haOpen, haClose));
      haLow=MathMin(iLow(which,0,pos)*bili, MathMin(haOpen, haClose));
      if (haOpen<haClose)
        {
         ExtMapBuffer1[pos]=haLow;
         ExtMapBuffer2[pos]=haHigh;
        }
      else
        {
         ExtMapBuffer1[pos]=haHigh;
         ExtMapBuffer2[pos]=haLow;
        }
      ExtMapBuffer3[pos]=haOpen;
      ExtMapBuffer4[pos]=haClose;
 	   pos--;
     }
//----
   return(0);
  }
//+------------------------------------------------------------------+
Comments