MBKAsctrend3times1
Download script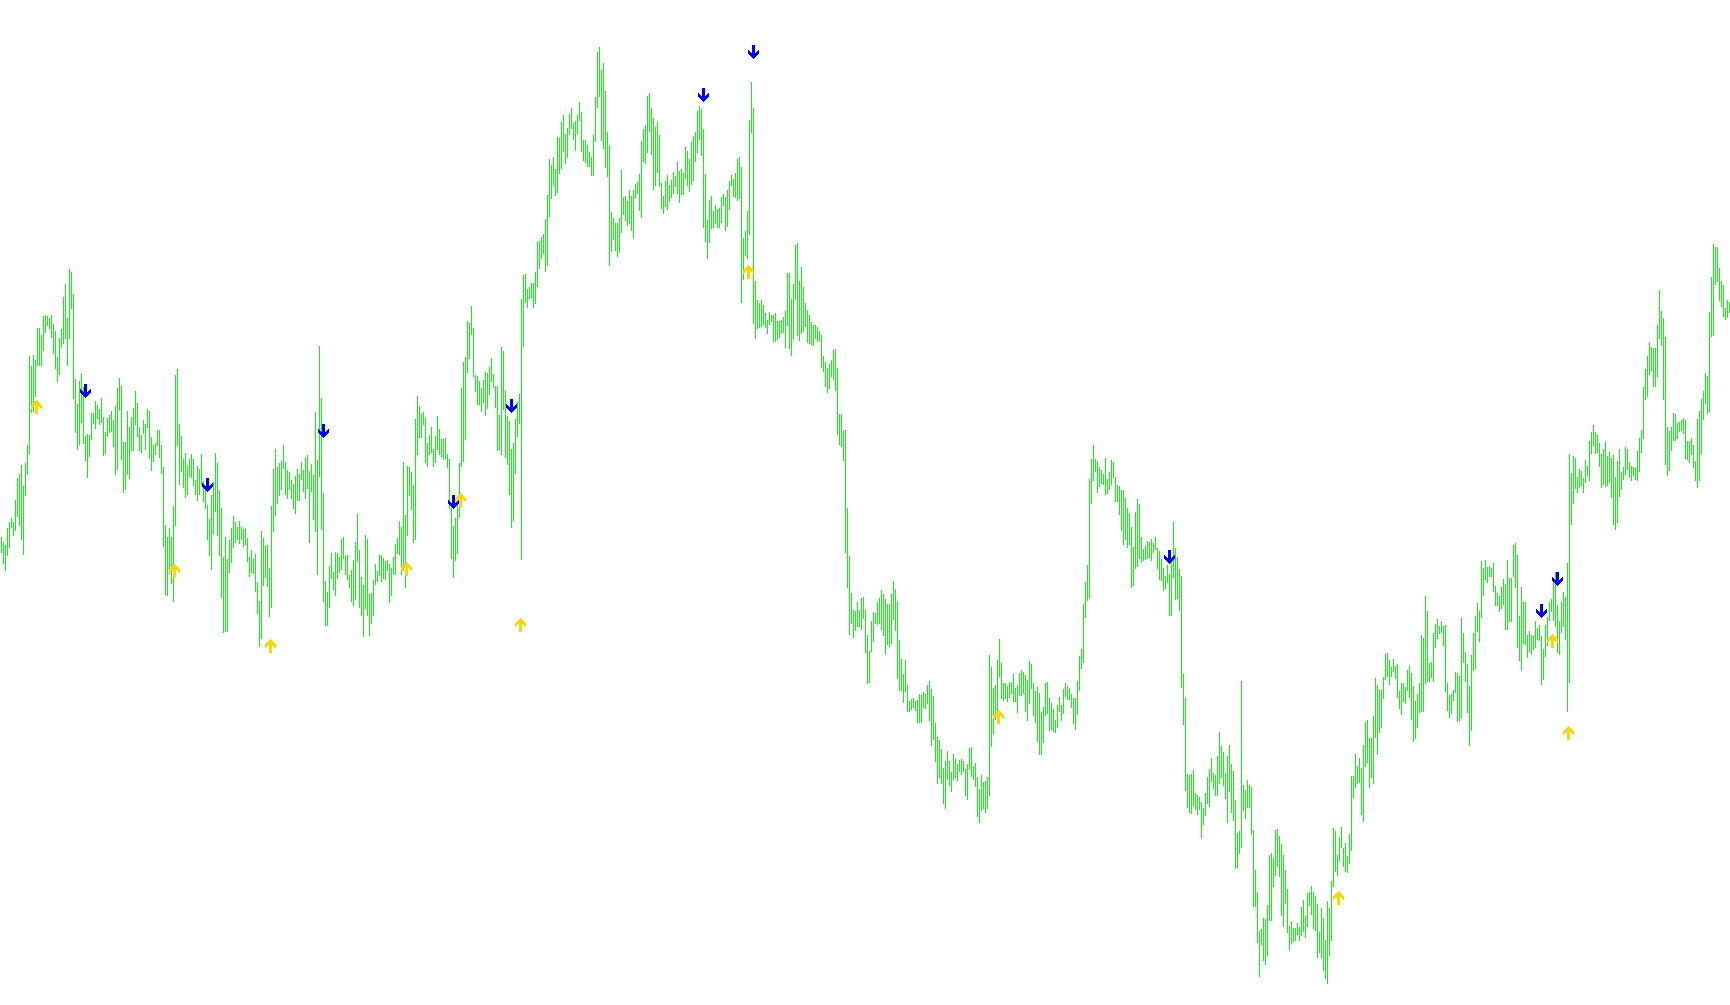
This script is designed as a visual trading indicator for the MetaTrader platform. Its primary purpose is to identify shifts in market momentum by analyzing price movements across three different time horizons simultaneously and filtering them through a "long-term" trend check.
Core Logic Overview
The tool works by calculating a weighted average of three different momentum values (known as Williams Percent Range). Instead of relying on a single data point, which can often produce "false signals" or noise, this script looks at the market's behavior over three distinct lengths: short-term, medium-term, and long-term.
How it Processes Data
1. Weighted Momentum Analysis The indicator takes three separate momentum readings. It then applies a specific mathematical weight to each one. In the default settings, the medium-term reading is given significantly more importance (a higher weight) than the short or long terms. This ensures that while the tool remains sensitive to quick moves, it primarily follows the most reliable trend data.
2. Long-Term Trend Filtering To prevent the indicator from giving signals during minor "wiggles" in the price, it includes a safety check. It compares the combined weighted momentum against a specific long-term threshold. A signal is only valid if the broader, long-term trend aligns with the current momentum move.
3. Dynamic Range Calculation The script looks at a small window of recent price history to determine the "Average Range" (the typical distance between the highest and lowest prices). This allows the indicator to place its visual markers dynamically. Instead of being at a fixed distance from the price, the markers appear relative to how volatile the market is currently behaving.
Visual Signals
The logic translates these calculations into two distinct actions on your chart:
- Buy Signals: When the weighted momentum crosses above a specific upper threshold and confirms with the long-term trend, the script identifies an "Uptrend." It places a visual marker (an arrow) below the price candle.
- Sell Signals: When the weighted momentum drops below a specific lower threshold and confirms with the long-term trend, it identifies a "Downtrend" and places a visual marker above the price candle.
Summary for the User
Essentially, this tool acts as a filter. It looks at three different "speeds" of market movement, prioritizes the most reliable medium-speed data, checks that the overall long-term direction is favorable, and then paints a clear signal on your chart when all these conditions meet the required criteria simultaneously.
//+------------------------------------------------------------------+
//| MBKAsctrend3times.mq4
//+------------------------------------------------------------------+
#property copyright "MBKAsctrend3times matt kennel"
#property link      "http://www.metatrader.org"

#property indicator_chart_window
#property indicator_buffers 2
#property indicator_color1 Blue
#property indicator_width1 1
#property indicator_color2 Red
#property indicator_width2 1

//---- input parameters
//
//
// Modified by MBK:  now have three different timescales (bar lengths)
// to combine for final WPR indicator, with further long-term trend indicator.
//
// try on H1 chart with these parameters.
//

extern int RISK=3;
//extern int CountBars=2000;
extern int NumberofAlerts=0;
extern int WPRLength1=9,WPRLength2=33, WPRLength3=77;
extern int LToffset = -5;
extern double w1=1.0, w2=3.0, w3 = 1.0; // relative weights
int counter=0;
//---- buffers
double val1[];
double val2[];

//+------------------------------------------------------------------+
//| Custom indicator initialization function                         |
//+------------------------------------------------------------------+
int init()
  {
   string short_name;
//---- indicator line
   IndicatorBuffers(2);
   SetIndexStyle(0,DRAW_ARROW);
   SetIndexArrow(0,233);
   SetIndexStyle(1,DRAW_ARROW);
   SetIndexArrow(1,234);
   SetIndexBuffer(0,val1);
   SetIndexBuffer(1,val2);
//----
   return(0);
  }
//+------------------------------------------------------------------+
//| SilverTrend_Signal                                               |
//+------------------------------------------------------------------+
int start() {
   //if (CountBars>=Bars) CountBars=Bars;
   //SetIndexDrawBegin(0,Bars-CountBars+SSP);
   //SetIndexDrawBegin(1,Bars-CountBars+SSP);
   int i1,i2,K;
   double Range,AvgRange,smin,smax,SsMax,SsMin,price;
   double wprvalue;
   static bool uptrend,old;
   bool flag1, flag2;
   int i,shift,counted_bars=IndicatorCounted();
///----

   //if(Bars<=SSP+1) return(0);
//---- initial zero
  //if(counted_bars<SSP+1)
 // {
//      for(i=1;i<=SSP;i++) val2[CountBars-i]=0.0;
//  }
////----

   K=33-RISK;
  // wprlength = 3+RISK*2;
   uptrend=false;
   old = false;
   double sumweights = w1+w2+w3;

   w1 /= sumweights;
   w2 /= sumweights;
   w3 /= sumweights;

   int SSP = 10;
   for (shift = Bars-SSP; shift>=0; shift--) {

	  Range=0;
	  AvgRange=0;
	  for (i1=shift; i1<=shift+SSP; i1++)
		 {AvgRange=AvgRange+MathAbs(High[i1]-Low[i1]);
		 }
	  Range=AvgRange/(SSP+1);


   double wprval1 = (100-MathAbs(iWPR(Symbol(),Period(),WPRLength1,shift)));
   double wprval2 = (100-MathAbs(iWPR(Symbol(),Period(),WPRLength2,shift)));
   double wprval3 = (100-MathAbs(iWPR(Symbol(),Period(),WPRLength3,shift)));

   wprvalue = w1*wprval1 + w2*wprval2 + w3*wprval3;

  //  MathPow(wprval1*wprval2*wprval3,1.0/3.0);

   double wprlong = wprval3;
  	if ((wprvalue < 33-RISK) && (wprlong < 50-LToffset)) {
		uptrend = false;
   }

	if ((wprvalue > 67+RISK) && (wprlong >= 50+LToffset)) {
		uptrend = true;
	}

   if (uptrend!=old && uptrend==true) {
      val1[shift]=Low[shift]-Range*0.8; // lower range
      counter=0;
      if (shift==0 && counter<=NumberofAlerts) {
         // Alert("MBKAsctrend ",Period()," ",Symbol()," BUY");
         counter=counter+1;
      }
   }

   if (uptrend!=old && uptrend==false) {
      counter=0;
      val2[shift]=High[shift]+Range*0.8;
      if (shift==0 && counter<=NumberofAlerts) {
        // Alert("Silver Trend ",Period()," ",Symbol()," SELL");
         counter=counter+1;
         }
   }
   Comment(shift);
   old=uptrend;

   }
   return(0);
}
//+------------------------------------------------------------------+
Comments