StepMa_StochSignal_v0
Download script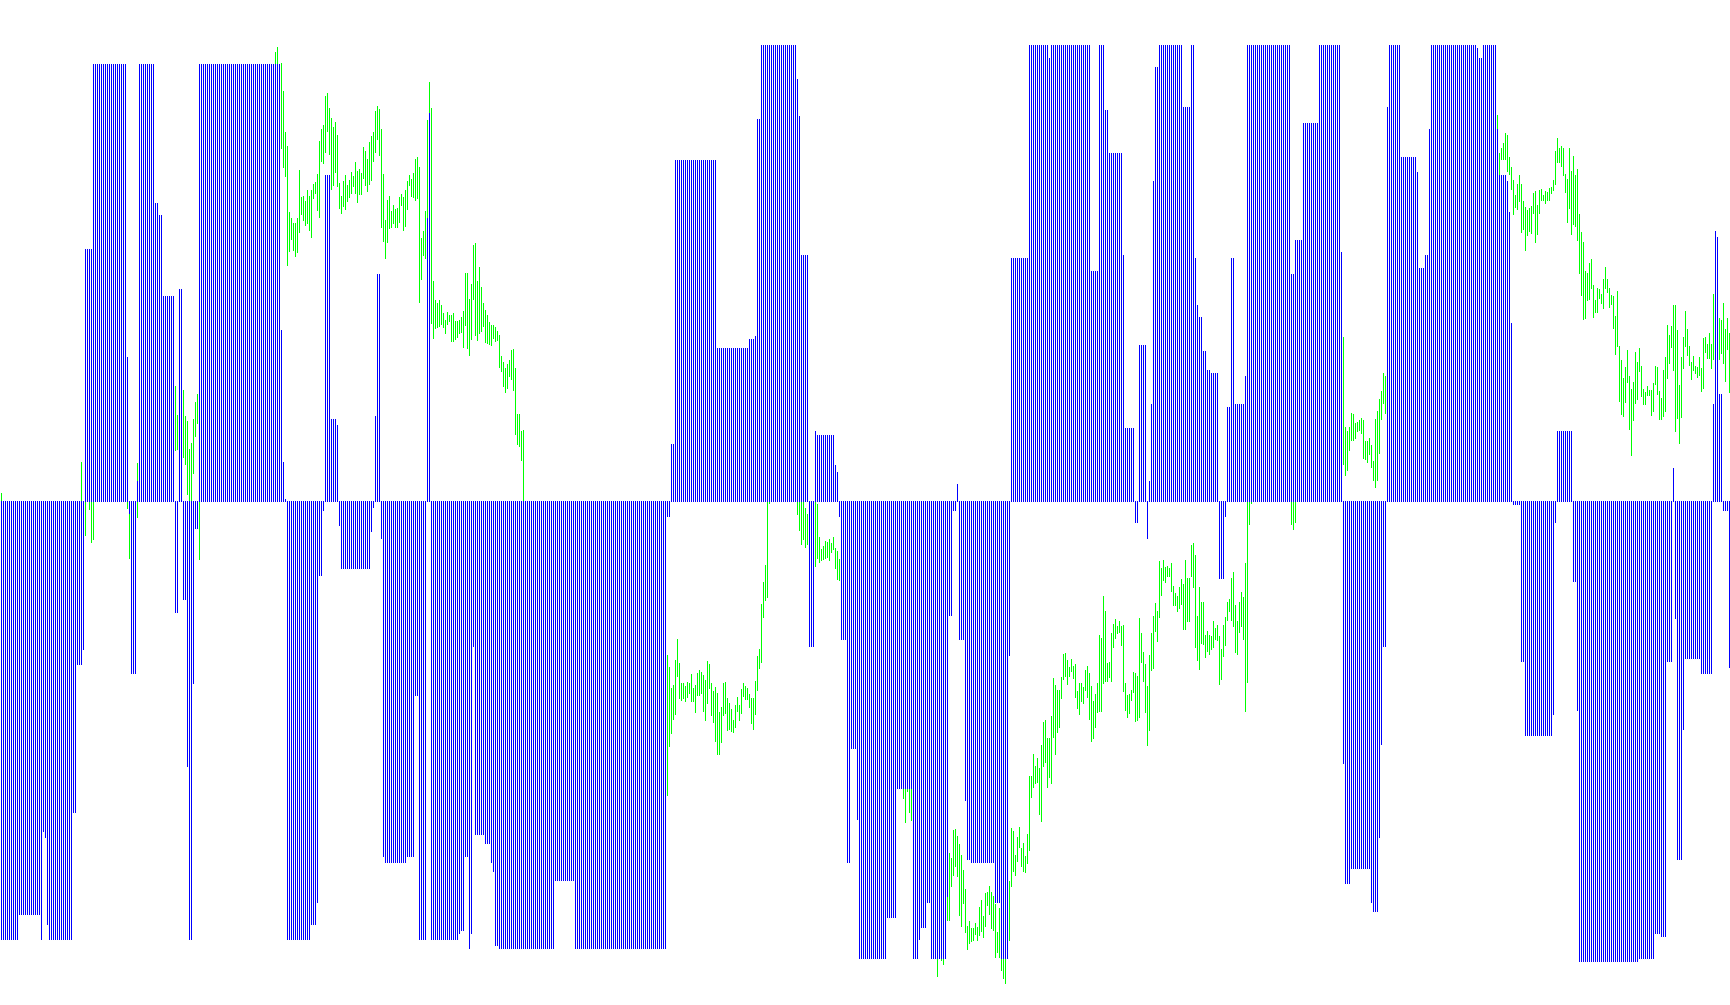
This script functions as a specialized technical analysis tool designed to measure market momentum and trend direction by calculating "steps" in price movement. Instead of simply following the raw price, it attempts to filter out market noise to identify the core underlying strength of a trend.
Core Logic Overview
The logic operates by establishing dynamic boundaries based on recent market volatility. It calculates the range of price fluctuations over a specific period and uses that data to create three distinct "zones" of movement: Minimum, Mid, and Maximum. These zones help distinguish between minor price wiggles and significant trend shifts.
How the Calculations Work
- Volatility Assessment: The tool first looks at a set number of past candles to determine the average range of the market (highs vs. lows). This ensures the indicator adapts automatically whether the market is moving slowly or aggressively.
- Trend Detection: Based on the volatility, it establishes boundaries around the current price. It then checks where the closing price sits relative to these boundaries:
- If the price breaks significantly above a boundary, it signals an upward trend.
- If it drops significantly below, it signals a downward trend.
- Step Dynamics: The script calculates "lines" based on these trends. It looks for the most stable point within the current trend to ensure that the indicator doesn't react too impulsively to every tiny price tick.
- Stochastic Conversion: Once these "step" lines are established, the tool converts their relative positions into a percentage-based scale (similar to how a Stochastic Oscillator works). It specifically compares the "Minimum" trend line against the "Maximum" trend line.
Visual Output and Interpretation
The script produces three main pieces of information for the user:
- Histogram: This represents the difference between two different trend intensities. It helps you see the immediate "gap" or separation between different types of price movements.
- Momentum Line: The tool takes that histogram data and applies a smoothing filter to it. This creates a momentum line that shows whether the strength of the trend is accelerating, decelerating, or reversing.
Summary for the User
In simple terms, this tool ignores the "noise" of minor price fluctuations and focuses on identifying the structural steps of a trend. By comparing different levels of price intensity, it provides a visual representation of how strong the current move is and whether that strength is beginning to wane.
/*-----------------------------+
|			       |
| Shared by www.Aptrafx.com    |
|			       |
+------------------------------*/

//+------------------------------------------------------------------+
//|                                              StepMA_Stoch_v1.mq4 |
//|                           Copyright © 2005, TrendLaboratory Ltd. |
//|                                       E-mail: igorad2004@list.ru |
//+------------------------------------------------------------------+
#property copyright "Copyright © 2005, TrendLaboratory Ltd."
#property link      "E-mail: igorad2004@list.ru"

#property indicator_separate_window
#property indicator_buffers 2
#property indicator_color1 LightGreen
#property indicator_color2 Gold
#property indicator_minimum -50
#property indicator_maximum 50

//---- input parameters
extern int PeriodWATR=10;
extern double Kwatr=1.0000;
extern int HighLow=0;

//---- indicator buffers
double LineMinBuffer[];
double LineMidBuffer[];
double stepSignalBuffer[];
double momBuffer[];

//+------------------------------------------------------------------+
//| Custom indicator initialization function                         |
//+------------------------------------------------------------------+
  int init() {
   string short_name;
//---- indicator line
   //SetIndexStyle(0,DRAW_LINE,STYLE_SOLID, 1);
   //SetIndexStyle(1,DRAW_LINE,STYLE_SOLID, 1);
   SetIndexStyle(1,DRAW_HISTOGRAM, STYLE_SOLID, 1);
   SetIndexStyle(2,DRAW_LINE,STYLE_SOLID, 1);
   //SetIndexBuffer(0, LineMinBuffer);
   //SetIndexBuffer(1, LineMidBuffer);
   SetIndexBuffer(1, stepSignalBuffer);
   SetIndexBuffer(2, momBuffer);

   IndicatorDigits(MarketInfo(Symbol(),MODE_DIGITS));
//---- name for DataWindow and indicator subwindow label
   short_name="StepMA Stoch("+PeriodWATR+","+Kwatr+","+HighLow+")";
   IndicatorShortName(short_name);
   //SetIndexLabel(0,"StepMA Stoch 1");
   //SetIndexLabel(1,"StepMA Stoch 2");
   SetIndexLabel(1,"StepMA Hist");
   SetIndexLabel(2,"StepMA Mom");
//----
   //SetIndexDrawBegin(0,PeriodWATR);
   //SetIndexDrawBegin(1,PeriodWATR);
   SetIndexDrawBegin(1,PeriodWATR);
   SetIndexDrawBegin(2,PeriodWATR);
//----
   return(0);
  }

//+------------------------------------------------------------------+
//| StepMA_3D_v1                                                         |
//+------------------------------------------------------------------+
int start() {
   int      i,shift,TrendMin,TrendMax,TrendMid;
   double   SminMin0,SmaxMin0,SminMin1,SmaxMin1,SumRange,dK,WATR0,WATRmax,WATRmin,WATRmid;
   double   SminMax0,SmaxMax0,SminMax1,SmaxMax1,SminMid0,SmaxMid0,SminMid1,SmaxMid1;
   double   linemin,linemax,linemid,Stoch1,Stoch2,bsmin,bsmax;

   for(shift=Bars-1;shift>=0;shift--)
   {
	SumRange=0;
	for (i=PeriodWATR-1;i>=0;i--)
	    {
       dK = 1+1.0*(PeriodWATR-i)/PeriodWATR;
       SumRange+= dK*MathAbs(High[i+shift]-Low[i+shift]);
       }
	WATR0 = SumRange/PeriodWATR;

	WATRmax=MathMax(WATR0,WATRmax);
	if (shift==Bars-1-PeriodWATR) WATRmin=WATR0;
	WATRmin=MathMin(WATR0,WATRmin);

	int StepSizeMin=MathRound(Kwatr*WATRmin/Point);
	int StepSizeMax=MathRound(Kwatr*WATRmax/Point);
	int StepSizeMid=MathRound(Kwatr*0.5*(WATRmax+WATRmin)/Point);

	if (HighLow>0) {
	  SmaxMin0=Low[shift]+2*StepSizeMin*Point;
	  SminMin0=High[shift]-2*StepSizeMin*Point;

	  SmaxMax0=Low[shift]+2*StepSizeMax*Point;
	  SminMax0=High[shift]-2*StepSizeMax*Point;

	  SmaxMid0=Low[shift]+2*StepSizeMid*Point;
	  SminMid0=High[shift]-2*StepSizeMid*Point;

	  if(Close[shift]>SmaxMin1) TrendMin=1;
	  if(Close[shift]<SminMin1) TrendMin=-1;

	  if(Close[shift]>SmaxMax1) TrendMax=1;
	  if(Close[shift]<SminMax1) TrendMax=-1;

	  if(Close[shift]>SmaxMid1) TrendMid=1;
	  if(Close[shift]<SminMid1) TrendMid=-1;
	}

	if (HighLow == 0) {
	  SmaxMin0=Close[shift]+2*StepSizeMin*Point;
	  SminMin0=Close[shift]-2*StepSizeMin*Point;

	  SmaxMax0=Close[shift]+2*StepSizeMax*Point;
	  SminMax0=Close[shift]-2*StepSizeMax*Point;

	  SmaxMid0=Close[shift]+2*StepSizeMid*Point;
	  SminMid0=Close[shift]-2*StepSizeMid*Point;

	  if(Close[shift]>SmaxMin1) TrendMin=1;
	  if(Close[shift]<SminMin1) TrendMin=-1;

	  if(Close[shift]>SmaxMax1) TrendMax=1;
	  if(Close[shift]<SminMax1) TrendMax=-1;

	  if(Close[shift]>SmaxMid1) TrendMid=1;
	  if(Close[shift]<SminMid1) TrendMid=-1;
	  }

	  if(TrendMin>0 && SminMin0<SminMin1) SminMin0=SminMin1;
	  if(TrendMin<0 && SmaxMin0>SmaxMin1) SmaxMin0=SmaxMin1;

	  if(TrendMax>0 && SminMax0<SminMax1) SminMax0=SminMax1;
	  if(TrendMax<0 && SmaxMax0>SmaxMax1) SmaxMax0=SmaxMax1;

	  if(TrendMid>0 && SminMid0<SminMid1) SminMid0=SminMid1;
	  if(TrendMid<0 && SmaxMid0>SmaxMid1) SmaxMid0=SmaxMid1;


	  if (TrendMin>0) linemin=SminMin0+StepSizeMin*Point;
	  if (TrendMin<0) linemin=SmaxMin0-StepSizeMin*Point;

	  if (TrendMax>0) linemax=SminMax0+StepSizeMax*Point;
	  if (TrendMax<0) linemax=SmaxMax0-StepSizeMax*Point;

	  if (TrendMid>0) linemid=SminMid0+StepSizeMid*Point;
	  if (TrendMid<0) linemid=SmaxMid0-StepSizeMid*Point;

	  bsmin=linemax-StepSizeMax*Point;
	  bsmax=linemax+StepSizeMax*Point;
	  Stoch1=(linemin-bsmin)/(bsmax-bsmin);
	  Stoch2=(linemid-bsmin)/(bsmax-bsmin);

	  LineMinBuffer[shift]=Stoch1;
	  LineMidBuffer[shift]=Stoch2;
	  stepSignalBuffer[shift]=(Stoch1-Stoch2)*100;
	  momBuffer[shift]= iMomentumOnArray(stepSignalBuffer, ArraySize(stepSignalBuffer), 13, 0);


	  SminMin1=SminMin0;
	  SmaxMin1=SmaxMin0;

	  SminMax1=SminMax0;
	  SmaxMax1=SmaxMax0;

	  SminMid1=SminMid0;
	  SmaxMid1=SmaxMid0;
	}

	return(0);
 }
Comments