StepMA_Stoch
Download script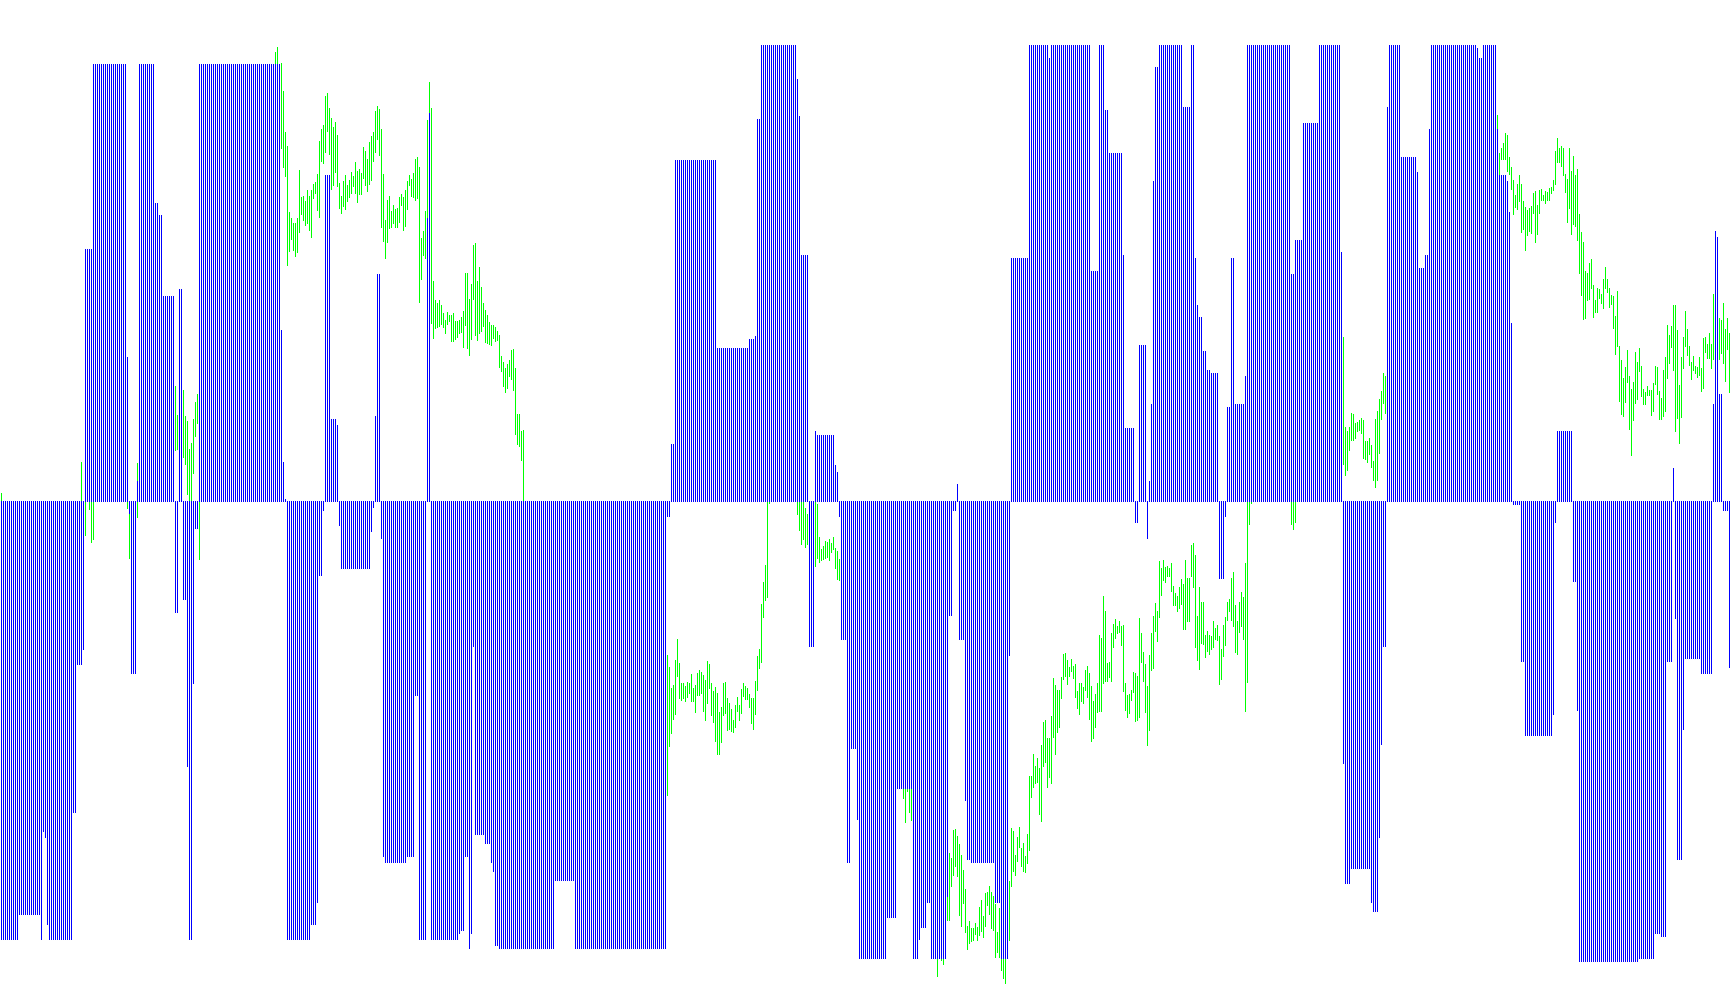
This script is a specialized technical analysis tool designed to help traders visualize market trends and momentum by identifying "steps" in price action. Instead of following every small wiggle in the market, it focuses on significant directional shifts, making it easier to see the underlying flow of the price.
How it Works
The logic functions by calculating the volatility of the market over a specific period. It looks at the historical highs and lows to determine how much the price typically moves, creating three distinct "zones" of intensity: Minimum, Maximum, and Mid-range.
1. Trend Detection The script monitors the current price relative to these calculated zones. Depending on whether you set it to look at high/low extremes or simply the closing price, it determines the direction of the trend. If the price breaks out of a specific zone, the script "locks in" that trend. It essentially ignores minor fluctuations as long as the price stays within its established boundary, only reacting when a significant move occurs.
2. The Step Logic Rather than moving smoothly like a standard moving average, this indicator treats price movements like a staircase (or a "step"). When a new trend is identified, it establishes a baseline for that movement. This helps filter out "market noise" and highlights the actual structural changes in price.
3. Momentum Calculation Once the trends are established, the script compares different levels of these steps to generate two specific visual signals:
- The Histogram: This represents the difference between the "Minimum" trend and the "Mid-range" trend. It shows the strength of the current move relative to a baseline.
- The Momentum Line: This takes that histogram data and applies a secondary calculation to smooth it out, showing how fast the momentum is accelerating or decelerating.
What this means for the user
By using this logic, you are looking at a filtered version of the market. Instead of seeing every tiny price change, you see a representation of significant structural moves.
- The Histogram helps you see the "push" behind the current trend.
- The Momentum Line helps you identify if that push is getting stronger, weaker, or starting to exhaust itself.
In short, it converts volatile price action into a structured "stepped" format to make it easier to spot clear trends and significant momentum shifts.
//+------------------------------------------------------------------+
//|                                              StepMA_Stoch_v1.mq4 |
//|                           Copyright © 2005, TrendLaboratory Ltd. |
//|                                       E-mail: igorad2004@list.ru |
//+------------------------------------------------------------------+
#property copyright "Copyright © 2005, TrendLaboratory Ltd."
#property link      "E-mail: igorad2004@list.ru"

#property indicator_separate_window
#property indicator_buffers 2
#property indicator_color1 LightGreen
#property indicator_color2 Gold
#property indicator_minimum -50
#property indicator_maximum 50

//---- input parameters
extern int PeriodWATR=10;
extern double Kwatr=1.0000;
extern int HighLow=0;

//---- indicator buffers
double LineMinBuffer[];
double LineMidBuffer[];
double stepSignalBuffer[];
double momBuffer[];

//+------------------------------------------------------------------+
//| Custom indicator initialization function                         |
//+------------------------------------------------------------------+
  int init() {
   string short_name;
//---- indicator line
   //SetIndexStyle(0,DRAW_LINE,STYLE_SOLID, 1);
   //SetIndexStyle(1,DRAW_LINE,STYLE_SOLID, 1);
   SetIndexStyle(1,DRAW_HISTOGRAM, STYLE_SOLID, 1);
   SetIndexStyle(2,DRAW_LINE,STYLE_SOLID, 1);
   //SetIndexBuffer(0, LineMinBuffer);
   //SetIndexBuffer(1, LineMidBuffer);
   SetIndexBuffer(1, stepSignalBuffer);
   SetIndexBuffer(2, momBuffer);

   IndicatorDigits(MarketInfo(Symbol(),MODE_DIGITS));
//---- name for DataWindow and indicator subwindow label
   short_name="StepMA Stoch("+PeriodWATR+","+Kwatr+","+HighLow+")";
   IndicatorShortName(short_name);
   //SetIndexLabel(0,"StepMA Stoch 1");
   //SetIndexLabel(1,"StepMA Stoch 2");
   SetIndexLabel(1,"StepMA Hist");
   SetIndexLabel(2,"StepMA Mom");
//----
   //SetIndexDrawBegin(0,PeriodWATR);
   //SetIndexDrawBegin(1,PeriodWATR);
   SetIndexDrawBegin(1,PeriodWATR);
   SetIndexDrawBegin(2,PeriodWATR);
//----
   return(0);
  }

//+------------------------------------------------------------------+
//| StepMA_3D_v1                                                         |
//+------------------------------------------------------------------+
int start() {
   int      i,shift,TrendMin,TrendMax,TrendMid;
   double   SminMin0,SmaxMin0,SminMin1,SmaxMin1,SumRange,dK,WATR0,WATRmax,WATRmin,WATRmid;
   double   SminMax0,SmaxMax0,SminMax1,SmaxMax1,SminMid0,SmaxMid0,SminMid1,SmaxMid1;
   double   linemin,linemax,linemid,Stoch1,Stoch2,bsmin,bsmax;

   for(shift=Bars-1;shift>=0;shift--)
   {
	SumRange=0;
	for (i=PeriodWATR-1;i>=0;i--)
	    {
       dK = 1+1.0*(PeriodWATR-i)/PeriodWATR;
       SumRange+= dK*MathAbs(High[i+shift]-Low[i+shift]);
       }
	WATR0 = SumRange/PeriodWATR;

	WATRmax=MathMax(WATR0,WATRmax);
	if (shift==Bars-1-PeriodWATR) WATRmin=WATR0;
	WATRmin=MathMin(WATR0,WATRmin);

	int StepSizeMin=MathRound(Kwatr*WATRmin/Point);
	int StepSizeMax=MathRound(Kwatr*WATRmax/Point);
	int StepSizeMid=MathRound(Kwatr*0.5*(WATRmax+WATRmin)/Point);

	if (HighLow>0) {
	  SmaxMin0=Low[shift]+2*StepSizeMin*Point;
	  SminMin0=High[shift]-2*StepSizeMin*Point;

	  SmaxMax0=Low[shift]+2*StepSizeMax*Point;
	  SminMax0=High[shift]-2*StepSizeMax*Point;

	  SmaxMid0=Low[shift]+2*StepSizeMid*Point;
	  SminMid0=High[shift]-2*StepSizeMid*Point;

	  if(Close[shift]>SmaxMin1) TrendMin=1;
	  if(Close[shift]<SminMin1) TrendMin=-1;

	  if(Close[shift]>SmaxMax1) TrendMax=1;
	  if(Close[shift]<SminMax1) TrendMax=-1;

	  if(Close[shift]>SmaxMid1) TrendMid=1;
	  if(Close[shift]<SminMid1) TrendMid=-1;
	}

	if (HighLow == 0) {
	  SmaxMin0=Close[shift]+2*StepSizeMin*Point;
	  SminMin0=Close[shift]-2*StepSizeMin*Point;

	  SmaxMax0=Close[shift]+2*StepSizeMax*Point;
	  SminMax0=Close[shift]-2*StepSizeMax*Point;

	  SmaxMid0=Close[shift]+2*StepSizeMid*Point;
	  SminMid0=Close[shift]-2*StepSizeMid*Point;

	  if(Close[shift]>SmaxMin1) TrendMin=1;
	  if(Close[shift]<SminMin1) TrendMin=-1;

	  if(Close[shift]>SmaxMax1) TrendMax=1;
	  if(Close[shift]<SminMax1) TrendMax=-1;

	  if(Close[shift]>SmaxMid1) TrendMid=1;
	  if(Close[shift]<SminMid1) TrendMid=-1;
	  }

	  if(TrendMin>0 && SminMin0<SminMin1) SminMin0=SminMin1;
	  if(TrendMin<0 && SmaxMin0>SmaxMin1) SmaxMin0=SmaxMin1;

	  if(TrendMax>0 && SminMax0<SminMax1) SminMax0=SminMax1;
	  if(TrendMax<0 && SmaxMax0>SmaxMax1) SmaxMax0=SmaxMax1;

	  if(TrendMid>0 && SminMid0<SminMid1) SminMid0=SminMid1;
	  if(TrendMid<0 && SmaxMid0>SmaxMid1) SmaxMid0=SmaxMid1;


	  if (TrendMin>0) linemin=SminMin0+StepSizeMin*Point;
	  if (TrendMin<0) linemin=SmaxMin0-StepSizeMin*Point;

	  if (TrendMax>0) linemax=SminMax0+StepSizeMax*Point;
	  if (TrendMax<0) linemax=SmaxMax0-StepSizeMax*Point;

	  if (TrendMid>0) linemid=SminMid0+StepSizeMid*Point;
	  if (TrendMid<0) linemid=SmaxMid0-StepSizeMid*Point;

	  bsmin=linemax-StepSizeMax*Point;
	  bsmax=linemax+StepSizeMax*Point;
	  Stoch1=(linemin-bsmin)/(bsmax-bsmin);
	  Stoch2=(linemid-bsmin)/(bsmax-bsmin);

	  LineMinBuffer[shift]=Stoch1;
	  LineMidBuffer[shift]=Stoch2;
	  stepSignalBuffer[shift]=(Stoch1-Stoch2)*100;
	  momBuffer[shift]= iMomentumOnArray(stepSignalBuffer, ArraySize(stepSignalBuffer), 13, 0);


	  SminMin1=SminMin0;
	  SmaxMin1=SmaxMin0;

	  SminMax1=SminMax0;
	  SmaxMax1=SmaxMax0;

	  SminMid1=SminMid0;
	  SmaxMid1=SmaxMid0;
	}

	return(0);
 }
Comments